Abstract
Mobile phones present a transformative opportunity to bridge the information gap among small-scale farmers in developing areas. This paper investigates the specific categories of agricultural information sought by small-scale farmers via mobile technology, using a sample of small scale darmers from Kipkelion sub-county, Kericho County. Data were analyzed across seven primary information categories: training, agricultural inputs, planting practices, pest management, general market access, produce pricing, and weather advisories. The findings reveal a marked disparity in usage across categories. Agricultural training information was the most frequently accessed domain (39.6%, n=44), followed by input information (19.8%, n=22). Conversely, usage was substantially lower for planting information (14.4% n=16), pest management (13.5% n=15n), general market information (13.5%, n=15), commodity price information (10.8%, n=12), and weather advisories (9.9%, n=11). The overall low utilization across core agronomic and economic categories demonstrates that while mobile phones show promise as capacity-building tools, systemic barriers such as digital literacy, cost, lack of localized content, and reliance on traditional extension structures hinder their adoption as comprehensive advisory mechanisms. Policy recommendations focus on expanding localized digital content, lowering connectivity barriers, and integrating m-Agri platforms with existing physical extension networks.
Keywords
mobile agriculture smallholder farmers agricultural extension digital literacy information and communication technologies (ICTs) Kenya
1. Introduction
Agricultural information flow is necessary to rural development, food security, and poverty reduction (Begho, T., & Ogisi, O. D. 2025; Kiwelu, J. E. M., & Ngulube, P. 2025; Marion, P., et al. 2024). Small-scale farmers require timely, accurate, and useful information on the whole agricultural value chain, from pre-planting, agronomical management practices to market pricing and climate adaptation. Traditionally, rural communities have relied on face-to-face extension services, radio, non-governmental organization (NGO) field visits, and informal peer networks to obtain agricultural advice. However, traditional extension models often struggle with high operational costs, limited officer-to-farmer ratios, and geographic isolation (Kihara K. et al 2026).
The rapid expansion of mobile telecommunications infrastructure across rural sectors has shown the potential of mobile phones for delivering agricultural extension services (Cherotich C., & Kibett J.K, 2026; Masoud, C., et.al. 2026). Mobile platforms can bypass physical infrastructure limitations, enabling real-time delivery of advisory services, weather updates, and market intelligence directly to smallholders (Odida, P. 2026).
Despite the theoretical benefits of mobile phone usage in agricultural production, empirical evidence showing how smallholders actually interact with these platforms across different information categories remains mixed (Wayagi, E. O et al 2025). Understanding which specific information types farmers prioritize, and which they neglect or cannot access via mobile devices is essential for designing targeted digital agricultural interventions. In order to close this gap, this study looks at the specific kinds of agricultural information that small-scale farmers look for on mobile devices.
2. Methodology
2.1 Research Design and Sampling
A quantitative descriptive survey approach was used in this study to evaluate mobile phone utilization for agricultural information retrieval among smallholder farmers. A simple random sampling technique was utilized to select N=112 respondents within the target rural farming community.
2.2 Data Collection and Instrumentation
A standardized questionnaire was used to collect data through in person interviews in order to account for the different literacy levels among farmers. The instrument captured demographic data and binary response indicators ("Yes" / "No") regarding whether respondents used their mobile phones to seek specific types of agricultural information across seven domains:
-
Pest Management Information
-
Weather Information
-
Market Information
-
Planting Information
-
Agricultural Input Information
-
Training Information
-
Commodity Price Information
2.3 Analytical Framework
Statistical software (SPSS) was used to process and analyze quantitative data using descriptive statistics. To determine the relative demand for each information type, descriptive statistics such as frequencies, raw percentages, valid percentages, and cumulative percentages were computed. Across all evaluated domains, the sample characteristics remained uniform:
-
Total Sample (N): 112 respondents
-
Valid Responses (n): 111 respondents (99.1%)
-
Missing Data: 1 system missing case (0.9%)
The analysis evaluates valid percentages (n=111) to maintain accurate baseline comparisons across all information categories.
3. Results
3.1 Overview of Information Types Sought
The empirical results reveal wide variation in the adoption of mobile devices across different agricultural information needs. Table 1 summarizes the frequencies and valid percentages across all seven evaluated domains.
| Information Domain | Access Status | Frequency (f) | Valid Percent (%) | Cumulative Percent (%) |
| Training Information | Yes | 44 | 39.6 | 39.6 |
| No | 67 | 60.4 | 100.0 | |
| Input Information | Yes | 22 | 19.8 | 19.8 |
| No | 89 | 80.2 | 100.0 | |
| Planting Information | Yes | 16 | 14.4 | 14.4 |
| No | 95 | 85.6 | 100.0 | |
| Pest Information | Yes | 15 | 13.5 | 13.5 |
| No | 96 | 86.5 | 100.0 | |
| Market Information | Yes | 15 | 13.5 | 13.5 |
| No | 96 | 86.5 | 100.0 | |
| Price Information | Yes | 12 | 10.8 | 10.8 |
| No | 99 | 89.2 | 100.0 | |
| Weather Information | Yes | 11 | 9.9 | 9.9 |
| No | 100 | 90.1 | 100.0 |
Note: Baseline total N=112; System Missing n=1).
3.2 Domain-Specific Analyses3.2.1 Training Information
Training information emerged as the most sought category among the surveyed smallholders. As shown in Table 2, 44 respondents (39.6%) reported using their mobile devices to access agricultural training and capacity-building materials, while 67 respondents (60.4%) did not.
| Category | Response | Frequency (f) | Percent (%) | Valid Percent (%) | Cumulative Percent (%) |
| Valid | Yes | 44 | 39.3 | 39.6 | 39.6 |
| No | 67 | 59.8 | 60.4 | 100.0 | |
| Total | 111 | 99.1 | 100.0 | ||
| Missing | System | 1 | 0.9 | ||
| Total | 112 | 100.0 |
3.2.2 Agricultural Input Information
Information regarding farm inputs such as high-yield seed varieties, fertilizers, and agrochemicals represented the second highest category of mobile phone usage. Table 3 indicates that 22 respondents (19.8%) used mobile phones to source input data, whereas 89 respondents (80.2%) did not.
| Category | Response | Frequency (fff) | Percent (%) | Valid Percent (%) | Cumulative Percent (%) |
| Valid | Yes | 22 | 19.6 | 19.8 | 19.8 |
| No | 89 | 79.5 | 80.2 | 100.0 | |
| Total | 111 | 99.1 | 100.0 | ||
| Missing | System | 1 | 0.9 | ||
| Total | 112 | 100.0 |
3.2.3 Planting Information
Accessing recommendations on crop establishment, planting schedules, and spacing recorded modest adoption. Table 4 demonstrates that 16 respondents (14.4%) utilized mobile phones for planting information, compared to 95 respondents (85.6%) who refrained from doing so.
| Category | Response | Frequency (fff) | Percent (%) | Valid Percent (%) | Cumulative Percent (%) |
| Valid | Yes | 16 | 14.3 | 14.4 | 14.4 |
| No | 95 | 84.8 | 85.6 | 100.0 | |
| Total | 111 | 99.1 | 100.0 | ||
| Missing | System | 1 | 0.9 | ||
| Total | 112 | 100.0 |
3.2.4 Pest Management Information
Mobile phone usage for pest diagnosis and management information was low. As detailed in Table 5, only 15 respondents (13.5%) accessed pest management advice through their mobile phones, while 96 respondents (86.5%) did not.
| Category | Response | Frequency (f) | Percent (%) | Valid Percent (%) | Cumulative Percent (%) |
| Valid | Yes | 15 | 13.4 | 13.5 | 13.5 |
| No | 96 | 85.7 | 86.5 | 100.0 | |
| Total | 111 | 99.1 | 100.0 | ||
| Missing | System | 1 | 0.9 | ||
| Total | 112 | 100.0 |
3.2.5 General Market Information
Similarly, seeking general market access data such as buyer locations, market availability, and distribution channels via mobile phones saw limited engagement. Table 6 indicates that 15 respondents (13.5%) used mobile devices for market information, while 96 (86.5%) relied on alternative sources.
| Category | Response | Frequency (f) | Percent (%) | Valid Percent (%) | Cumulative Percent (%) |
| Valid | Yes | 15 | 13.4 | 13.5 | 13.5 |
| No | 96 | 85.7 | 86.5 | 100.0 | |
| Total | 111 | 99.1 | 100.0 | ||
| Missing | System | 1 | 0.9 | ||
| Total | 112 | 100.0 |
3.2.6 Commodity Price Information
Specific price discovery by using mobile platforms was low among the surveyed sample. As presented in Table 7, only 12 respondents (10.8%) retrieved pricing data using their phones, while 99 respondents (89.2%) did not.
| Category | Response | Frequency (f) | Percent (%) | Valid Percent (%) | Cumulative Percent (%) |
| Valid | Yes | 12 | 10.7 | 10.8 | 10.8 |
| No | 99 | 88.4 | 89.2 | 100.0 | |
| Total | 111 | 99.1 | 100.0 | ||
| Missing | System | 1 | 0.9 | ||
| Total | 112 | 100.0 |
3.2.7 Weather Information
Weather updates and climate advisories represented the least sought information type via mobile phones. Table 8 reveals that only 11 respondents (9.9%) utilized mobile platforms to access weather updates, while 100 respondents (90.1%) did not.
| Category | Response | Frequency (f) | Percent (%) | Valid Percent (%) | Cumulative Percent (%) |
| Valid | Yes | 11 | 9.8 | 9.9 | 9.9 |
| No | 100 | 89.3 | 90.1 | 100.0 | |
| Total | 111 | 99.1 | 100.0 | ||
| Missing | System | 1 | 0.9 | ||
| Total | 112 | 100.0 |
4. Discussion
The empirical findings show a significant dynamic in which, despite the widespread possession of mobile phones, smallholders' proactive use of mobile platforms to obtain specialized agricultural assistance remains low.
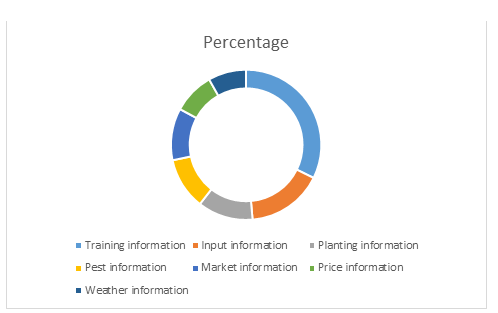
Relative importance of educational content
The relative dominance of training information (39.6%) indicates that farmers view mobile devices primarily as tools for capacity building, skill acquisition, and educational engagement through SMS tips, instructional videos, or WhatsApp extension groups. This agrees with findings by Kirui J et. Al., (2015). Compared to daily operational measurements, farmers may believe that training and instructional materials provide long-term value, promoting greater uptake.
Underutilization of dynamic operational data on a systemic level
The low rates of utilization for time-sensitive, dynamic operational parameters, specifically pricing (10.8%) and weather forecasts (9.9%) present a crucial analytical insight. In theory, mobile technology offers its greatest comparative advantage in distributing real time information. However, the data show that smallholders rarely rely on mobile channels for these inputs. This could be explained away by constraints that continue to limit farmers’ use of mobile (Gouroubera et.al, 2025; Muromba, P., Keeni, M. & Fuyuki, K, 2025; Shah, A. 2026).
5. Conclusion and Recommendations
5.1 Conclusion
This study investigated the types of agricultural information sought by small-scale farmers using mobile phones. The results show that mobile technology is not yet fully utilized as a flexible agricultural advisory tool among the surveyed smallholders. Although mobile channels have become popular for acquiring agricultural training (39.6%) they are still not widely used for primary operational decisions such as input selection (19.8%), planting advice (14.4%), pest control (13.5%), market access (13.5%), price discovery (10.8%), and weather forecasting (9.9%). In order to close these gaps, mobile agriculture services that are blended, user friendly, and localized must be designed, going beyond simple network connectivity.
5.2 Recommendations
Based on these findings, the following actions are recommended for policy-makers, extension agencies, and technology developers:
-
Develop interactive, blended learning platforms: Given the relatively high demand for training information (39.6%), extension institutions should prioritize interactive audio-visual modules, localized voice responses (IVR), and micro learning channels delivered using accessible social applications such as WhatsApp, and specialized community platforms).
-
Improve local and context specific content: Mobile service providers and ministries of agriculture must work together to provide localized, high resolution weather forecasts and real time, market information to make operational advisories actionable.
-
Combine digital tools with human extension services: Mobile tools should be developed as complementary tools rather than replacing physical extension officers. Field extension workers can use mobile applications during field visits to demonstrate pest diagnostics and interpret price trends alongside farmers.
-
Enhance user experience and reduce costs: To guaranty fair access for smallholders with limited resources, USSD and SMS designs should be made simpler, translated into regional languages, and zero-rated through public-private partnerships with telecom carriers.
-
Strengthen farmers' digital literacy: To increase farmers' confidence in using digital agricultural platforms, targeted digital literacy training should be incorporated into current farmer field school (FFS) programs.
References
- Begho, T., & Ogisi, O. D. (2025). A systematic review of the role of networks in information dissemination and resource pooling among farmers in Sub-Saharan Africa: Impact on farm improvements, empowerment and behaviour change. Journal of International Development, 37(5), 1070–1081. DOI ↗ Google Scholar ↗
- Cherotich Carolyne, and Kibett J.K, (2026). Phones in the Field: Unlocking Agricultural Information for Smallholder Farmers in Kericho County, Kenya. IOSR Journal of Multidisciplinary Research (In press). DOI ↗ Google Scholar ↗
- Gouroubera MW, Segnon AC, Tonle FBN and Zougmoré RB (2025) Farmers’ willingness to pay for weather and climate information services in sub-Saharan Africa: a systematic review with meta-analysis. Front. Clim. 7:1692594. doi: DOI ↗ Google Scholar ↗
- Kihara Kariuki, J., Gitau, R., & Mutai, B. K. (2026). Determinants of market intelligence usage among smallholder potato Agri-enterprises in Kenya. Frontiers in Sustainable Food Systems, 10, Article 1858591. DOI ↗ Google Scholar ↗
- Kirui J, Maritim W, Kiptot E, Wafula S, Ngaina JN, Kugonza J. 2015. Mobile phone ownership and use of short text message service by farmer trainers: a case study of Olkalou and Kaptumo in Kenya. ICRAF Working Paper No. 206. Nairobi, World Agroforestry Centre. DOI: DOI ↗ Google Scholar ↗
- Kiwelu, J. E. M., & Ngulube, P. (2025). Empowering rural smallholder farmers: Access to maize postharvest handling information for sustainable food security in Uganda. Cogent Food & Agriculture, 11(1). DOI ↗ Google Scholar ↗
- Marion, P., Lwamba, E., Floridi, A., Pande, S., Bhattacharyya, M., Young, S., Villar, P. F., & Shisler, S. (2024). The effects of agricultural output market access interventions on agricultural, socio-economic, food security, and nutrition outcomes in low- and middle-income countries: A systematic review. Campbell Systematic Reviews. DOI ↗ Google Scholar ↗
- Masoud, C., Geoffrey, A., Segero, C., Joseph, A., & Ochwoto, G. (2026). Evaluating the impact of a mobile decision-support tool on smallholder crop management and productivity in the coastal region of Kenya. International Journal of Scientific Research and Management (IJSRM), 14(5). DOI ↗ Google Scholar ↗
- Muromba, P., Keeni, M. & Fuyuki, K. (2025). A systematic review of mobile agricultural service applications for smallholder farmers in sub-Saharan Africa: perspectives from the technology acceptance model. Agric & Food Secur 14, 34. DOI ↗ Google Scholar ↗
- Odida, P. (2026). Effect of the use of Agricultural Mobile Apps on Agricultural Productivity by Small-scale Farmers in Kabiyet Ward, Nandi County. Africa Journal of Technical and Vocational Education and Training, 11(1), 89–98. DOI ↗ Google Scholar ↗
- Shah, A. A. (2026). Digital agriculture and extension: A review of ICTs, mobile applications, AI, IoT, and decision-support tools for sustainable farming. Research Journal of Agricultural Sciences, 17(1). DOI ↗ Google Scholar ↗
- Wayagi, E. O., Otieno, D. J., Nyikal, R. A., Okello, J. J., & Kawarazuka, N. (2025). Gender-age differences in the use of ICT platforms among potato farmers in Kenya. Cogent Food & Agriculture, 11(1), Article 2568754. DOI ↗ Google Scholar ↗