Abstract
The aim of this study was to evaluate the performance of a mechanical solar tracker. The tracker is designed to rotate basing on the rate of mass reduction on one side of the lever. A multichannel voltage logger was used to record the voltage from the terminals of a horizontally leveled pyrometer of calibration factor 5Wfor every mV measured intensity. The voltage logger also collected, read and recorded the voltage across the 5 Ω resistor connected to the output terminals of the solar panel as it rotated. A total energy of 4286.9564Wh and 3150.8132Wh, was obtained for the tracked and none tracked solar modules for twenty days of data collected. A corresponding energy fractional increase in the amount of energy of 0.2650.
Keywords
Mechanical solar tracker Rate of mass reduction Intensity Voltage and Total energy output.
1. Introduction
1.1 Background
Due to the numerous technological advancements, electricity is increasingly becoming a basic need. Electricity is needed for phone charging, hair cutting, operating television sets and powering computers which have become essential for communication (ADB, 2015). Although increasingly important, only about 26.7% of Uganda’s population is connected to the national grid (World Bank, 2016). A plausible reason for this low national grid coverage is the cost of generation and transmission of electricity which translate to high tariffs charged on the end users.
Consequently, over 94% of Uganda’s energy demand is met by biomass in form of charcoal or fuel wood. Alternative energy sources especially the renewable sources are prospective for solving the electricity shortage. They include; solar energy, hydropower, wind energy, geothermal energy and biomass energy. These energy sources do not emit air pollutants, diversify the energy supply and reduce dependence on depreciable and expensive energy sources.
Of the renewable energy sources, solar energy provides the best alternative. This is due to the ever decreasing overhead costs and increasing efficiencies. However, the efficiency of solar photovoltaic is influenced by intrinsic and extrinsic f9875actors. Intrinsic factors include; such as cell temperature. As temperature increases, the band gap of the semiconductor shrinks and open circuit voltage decreases. The higher the energy conversion efficiency, the maximum power point tracking.
The outdoor performance of a photovoltaic module is influenced by moving factors. Some of these issues are related to the location and environment. Few of these major factors include material degradation, solar irradiation, module temperature, parasitic resistance, tilt factor, shading, soiling, tilt angle and others.
Solar photovoltaic usually degrade, the degradation process may be chemical, electronic, and thermal or mechanic in nature, it may be due to the design flaws, fair quality materials in nature or manufacturing issues.
Module temperature, the photovoltaic cell is very sensitive to temperature. The efficiency and power output of a photovoltaic cell reduces with increase in temperature. This is mainly due to the increase in internal carrier recombination rates caused by increased carrier concentration.
Shading results in mismatches in the general currents of individual cell modules. Even partial shading on a single cell can be significant in reducing the power output of the entire module as if all cells were shaded.
Potential induced degradation, due to stray currents leading to gradual loss of power.
Soiling, accumulation of dust, dirt and other contaminants of photovoltaic module. This leads to the formation of a thin screen over the module and this reduces the light falling on one or more cells.
Photovoltaic module orientation and tilt angle. It is the worst case and must be avoided inform of poor location, timing and for capturing optimum solar energy. A photovoltaic module the incident light should be perpendicular to the module.
Variation in solar radiation, it affects the photovoltaic modules under varying light conditions and affects many parameters.
Parasitic resistance, the series and short resistance of the photovoltaic cell results in increased resistance loss hence reduced module efficiency. It comprises of the resistance of metal contact, fingers impurities and resistance of semiconductor itself.
However the above tracking systems are not commonly used in Uganda as they are expensive and most Ugandans cannot afford them. They also have other associated problems such as lack of technical knowledge in their use and operation, high procurement and maintenance costs.
The proposed model of the solar tracker in this report is simple and easy to operate. It uses the locally available materials in its setup. No data algorithms are involved in its setup and operation. It’s mechanically operated using the principle of reduction in changes of rates enabling the movement by addition and reduction in masses which can be determined and fixed for rotation of the solar tracker. This would be a better option and would provide the solution to the problems of other solar trackers. However, its efficiency is not known and that’s why its use is still limited.
2 Materials
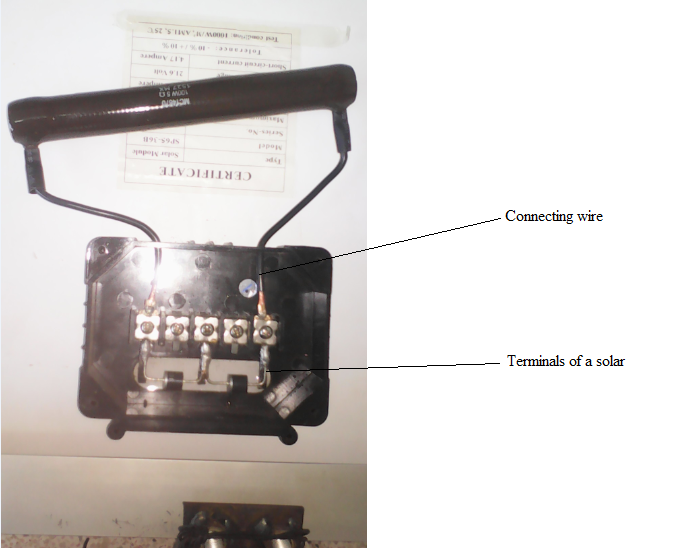
Materials used for the construction and performance evaluation of the solar tracker included: Metallic stands which were used for mounting and rotating the solar module, a monocrystalline silicon solar module of dimensions 76cm×66.5cm having a voltage of 18volts and maximum current of 3.61A. The module was used to evaluate the performance of the tracker, (include why we chose the 5ohm resistor) a 5 Ω resistor used to determine the potential difference. Rocks placed in a polythene bag used as fixed weights. A plastic bag clipped to allow water to drip at a chosen rate and a multichannel voltage logger used to record voltages. A straw was used for checking the shadow to detect whether the solar panel was perpendicular to the solar rays. A stop clock and measuring cylinder used to measure time and the volume of water that drips out of the bag respectively. The dripping water helps in the rotation of the solar panel.
2.1 Pyranometer model SP-110
A pyranometer is a type of instrument used for measuring solar irradiance on a planner surface and it is designed to measure the solar radiation flux density. A pyranometer is operated based on the measurement of temperature difference between a clear and dark surface. The black courting on the thermopile sensor absorbs the solar radiation, while the clear surface reflects it and hence less heat is absorbed. The thermopile is used to measure this temperature difference. The potential difference created in the thermopile owing to the temperature gradient between the two surfaces is used for measuring the amount of solar radiation. The voltage produced can be measured using a potentiometer.
Apogee SP series is made of silicon cells which are sensitive to a portion of the spectrum. The pyranometer is calibrated to estimate the total short wave radiation across the entire solar spectrum. The sensors output an analog voltage that is directly proportional to the total shortwave radiation from the sun (Apogee Instruments, 2014). SP series sensors output an analog voltage that is directly proportional to the total radiation from the sun. The sensor is connected to the data logger that is capable of measuring and displaying a millivolt signal”. (Apogee Instruments, 2014)
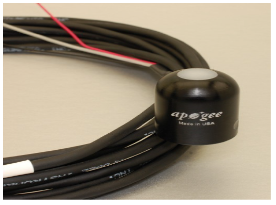
A horizontally levelled pyranometer of sensitivity 0.2mV per W m -2 that gives a calibration factor of 5 W m -2 for every mV.
2.2 Multichannel voltage logger
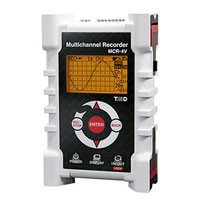
This is an electronic device that records data over time. It consists of an in built instrument or sensor based on digital processor and has a small, battery powered portable that is equipped with microprocessor. The microprocessor has an internal memory for data storage and sensors. The data logger interface with a personal computer and uses software to activate the data logger to view and analyze the collected data. It automatically collects data on a 24hours basis. Upon activation, data logger are typically deployed and left unattended to measure and record voltage information for duration of the monitoring period.
It is an electronic device that records data over time. It has an inbuilt instrument or sensor. It’s based on digital processor and has a small battery powered and equipped with microprocessor , sensors and internal memory for data storage. (T and D Corporation, 2015).
2.3 Construction of solar tracker.2.3.1 Theory of operation
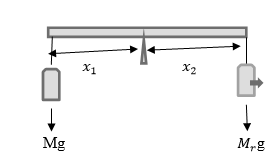
When multiple forces are applied on a fixed body, equilibrium is obtained when the sum of clockwise moments is equal to the sum of anticlockwise moments and the sum of parallel forces is equal to zero. Moment of a force is the product of a force and its perpendicular distance from the line of action of the fulcrum. When one force exceeds another, motion occurs in the direction of the greater force. If the moment of a force in one direction exceeds another, the rational motion occurs. This motion can be controlled varying the moment of one of the forces. This can be achieved by either changing the perpendicular distance or the force at a defined point. The tracker is designed such that equal weights are placed equidistant from the pivot. The distances m -2 and x 1 (from Figure 3.2) are made equal and fixed from the pivot to allow the module to balance horizontally Using the principle of moments and volume rate change, the
Mg x 2 = x 1 g M r .
For x 2 = x 1 and having a fixed weight of Mg, when x 2 g reduces rotation about the pivot occurs. From
As M r reduces with M r g , X 1 and X 2 fixed, a constant rate of rotation is achieved.
2.3.3 Construction
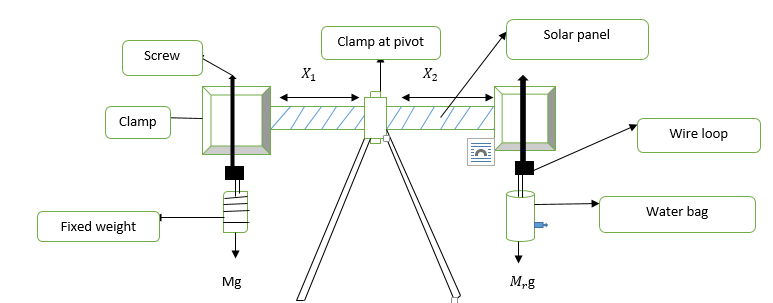
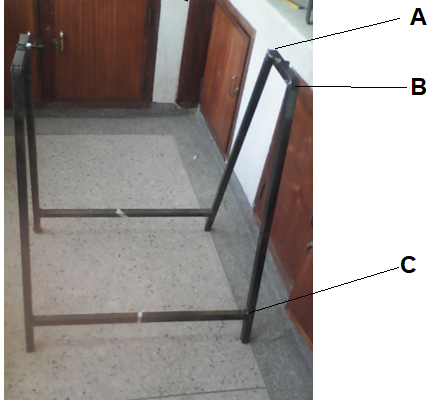
The different parts of the stand were welded together. The mounts were prepared and lubricated to allow for easy turning. All the components are attached to one another as shown in Figure 2.4 .
2.4 Performance evaluation
The performance of the constructed mechanical solar tracker was evaluated by assessing the difference in the module output when horizontally fixed and when mounted on the solar tracker. Data processing and analysis was done.
2.4.1 Sample Collection
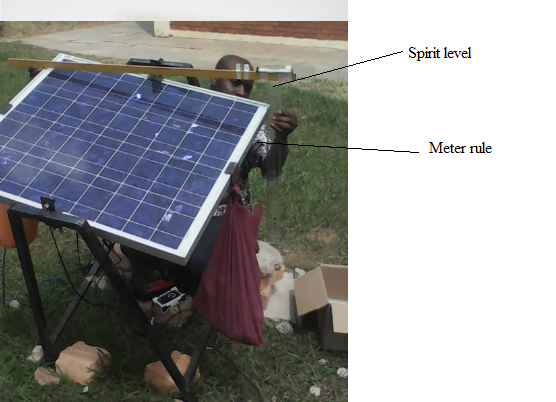
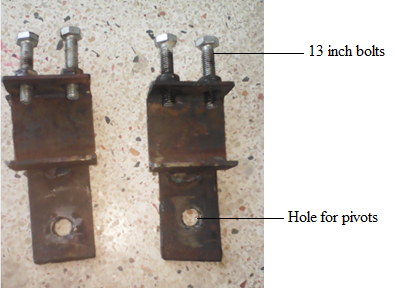
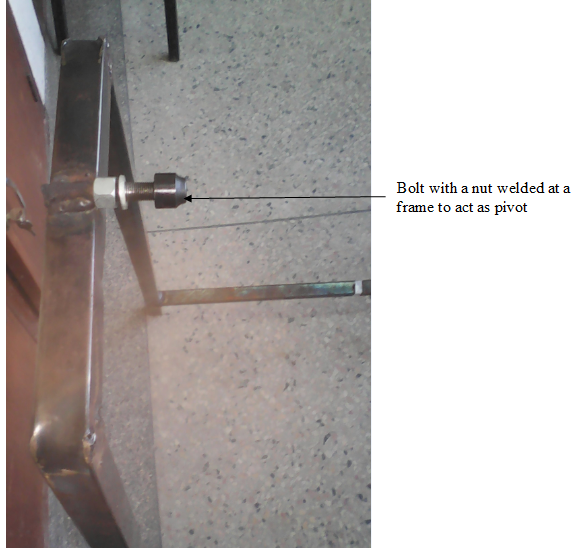
A fixed solar pv and the pyranometer are leveled and connected to different channels of data logger. Measurements are taken with the panel hinged in the middle using a pair of clamps fitted with a bolt that allow rotation. The clip was adjusted to a desired level to obtain a constant rate of flow of water out of the plastic bag. The rate of flow is maintained to bring the imbalance of the loads ensuring a constant rate of rotation of the solar module about the pivot. The solar panel is first horizontally leveled and balanced at pivot using a meter rule and spirit level. A bag filled with 5 litres of water is hang on one side of the solar panel. To the oppose side of the same panel is hang a weight. Horizontal level and balance are restored about the pivot between the 5litres of water and the weights. This is achieved by adding and reducing on the weights and maintaining same distances from the pivot. The weights are reduced by removing one at a time so that the solar panel inclines facing the east. The plastic bag with a clip fitted on it is adjusted thus controlling the amount of water that dips out of it. Several adjustments on the clip are made with the use of the measuring cylinder and a stop clock to ensure that the water drips out at a rate of 10 ml per minute. This rate was arrived at using the fact that the sun sweeps out an angle of Mg in 24 hours. As the amount of water reduces on one side of the panel and maintaining same weight on its other opposite side, the solar panel rotates about the pivot at a constant rate. The pyranometer outputs were also connected to the multichannel voltage logger to collect and record the equivalent voltage the solar panel would have absorbed. The two voltage data outputs were plotted on the same graph to form a scatter graph. The line of best fit was determined from the graph that gave a cubic type of curve between the two plots. The equation was determined for the relationship between the two data sets. The data was collected between 17/05/2016 to 17/06/2016.
2.4.2 Calibrating the pyranometer
The pyranometer leveled besides the horizontal fixed solar pv and is connected to the two different channels of a data logger to record the voltage output from each simultaneously. The readings are measured, recorded and stored on the internal memory of the data logger set to take data at a 15 seconds time interval for sunshine hours. Data is then downloaded and a graph of voltage output from solar cell against voltage output from pyranometer is plotted. This gives a calibration curve whose cubic equation was chosen because it gave a best fit to the data points.
2.4.5 Energy output
As the solar panel rotates, the height of the solar panel keeps changing horizontally. A square meter ruler together with a spirit level attached to it, different heights of rotation with the horizontal at a 30 minute interval were measured and recorded as h.
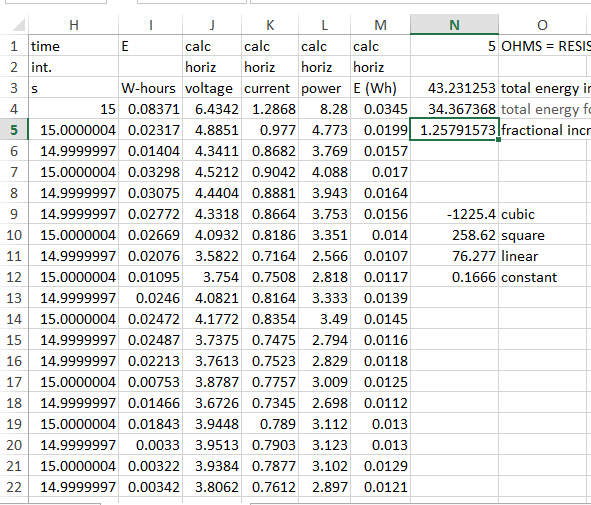
When the solar panel is being rotated, the recorded voltage out of its terminals connected across the resistor, R = 5 Ω is used to calculate the current. I = 360 0 and Power is thus calculated from P = V R *R. The voltage data logger is set to take data at an interval of t = 15seconds. The energy for each data point is calculated that is E = P*t.
Energy is in joules, Power is in watts, Time is converted to hours.
The voltage (V) of the terminals connected across a resistor (R) in ohms, of the tracked solar panel are recorded. The power calculate using = I 2 .Since the voltage data logger is set to take data at an interval of time. Energy = V 2 R is in joules when power is in watts and time converted to hours. Thus E = P×t this was done for each and every other time interval to find the energy collected for a whole day. Energy collected in a day V 2 t R = E T ). The same steps were repeated for each and every other day until n days. The collected energy amount for each day were summed up to give ∑ ( V 2 t R for a tracked solar panel.
For a horizontal solar panel the voltage is found from the intensity falling on a pyranometer with a known calibration factor of 0.2 mV per W ∑ E T . This voltage is read and recorded by the voltage logger as m -2 voltages for each data point and when substituted into the calibration equationgives voltage y for horizontal solar panel. Power for horizontal solar panel of each data point is calculated using the relationship x .This power is multiplied by time t in hours to obtain the energy output for the horizontal solar panel.
The voltage data from the pyranometer for a particular intensity and the voltage across attached at the terminal output of the horizontally oriented solar panel for a single day were plotted to give a calibration curve. The cubic equation was chosen because it gave a good fit to the scatter data points plotted for a single day. The value P= y 2 R represents the pyranometer voltage for a particular intensity within an interval of time as set for a multi voltage channel logger. The x value would be substituted into the selected cubic equation to give the value of voltage for a horizontal solar module. Hence x is the voltage for same solar panel when horizontally oriented for data point as recorded by a multi voltage channel logger set at that time knowing the voltage y and resistance R, power P was calculated using y . Energy collected from the horizontally oriented solar panel = P= y 2 R . The same procedures for calculation of energy are followed for every other t seconds for a whole day. The energy collected in a day y 2 t R and E H = ∑ ( y 2 t R ) for the n days of data collection determined.
The energy collected for each day from the tracked and horizontally oriented solar panel are calculated and recorded. The difference between the two energies ( ∑ E H is calculated and recorded. The fractional percentage energy increase for each day is calculated using the equation ;[( E T - E H ) - E T ] ×100
Where E H ) ÷ E H = energy for rotated solar panel a day, E T = energy for horizontally oriented solar panel for each day.
The total energy collected E H for the tracked solar panel was calculated by summing energy collected for n days. The total energy collected ( ( ∑ E T ) from a horizontally oriented same solar panel was calculated by summing the energy collected for each day for n days.
Results and discussion
3.1 Constructed mechanical solar tracker
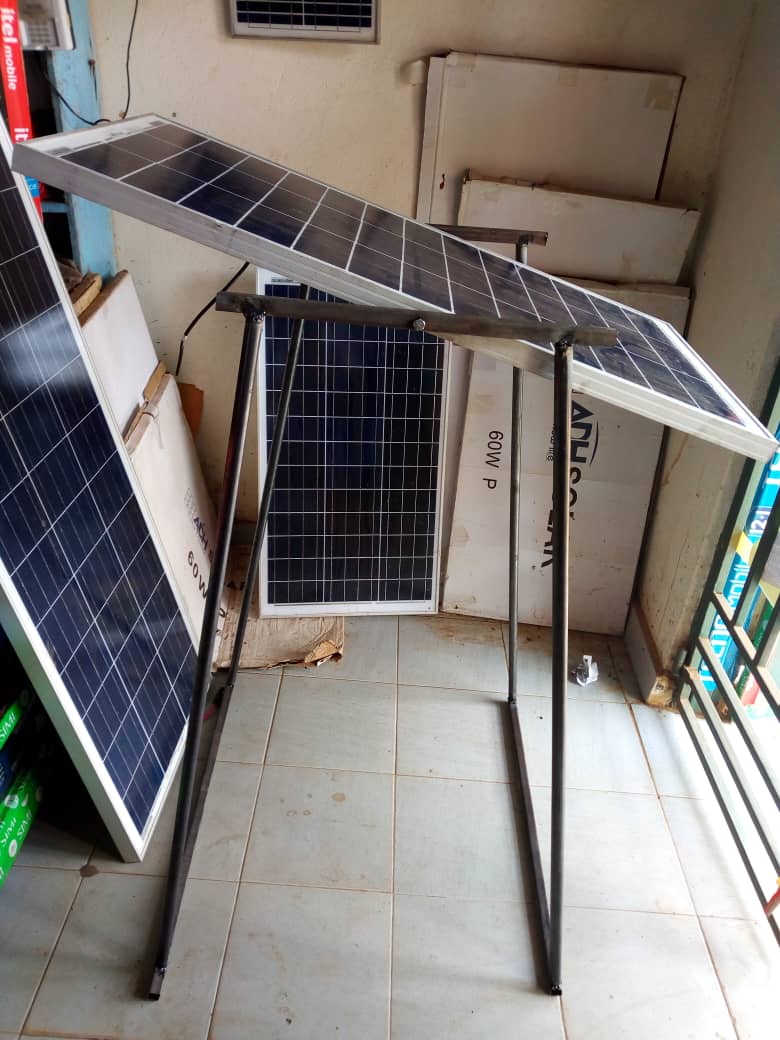
The solar tracker was set up as shown in the Figure 4.5. The tracked solar panels were connected to the multichannel voltage logger that recorded voltages throughout the day at given intervals of time. The water in the bag would drop out enabling its weight to lower and facilitate rotation.
3.2 Calibration of the Pyranometer
A curve of best fit was drawn and the equation that best describes the relationship is a polynomial equation of degree three given by the equation. y = -1225.4 ∑ E H ) + 258.62 x 3 + 76.277x + 0.166.
It predicts the relationship between the pyranometer voltage and what the fixed horizontal solar pv and brings about the cubic equation curve that is used to calculate the voltage y across the horizontal solar panel.
3.3.0 Diurnal variation in the tracker performance
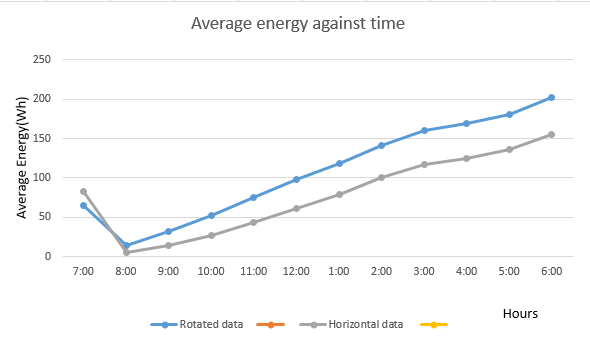
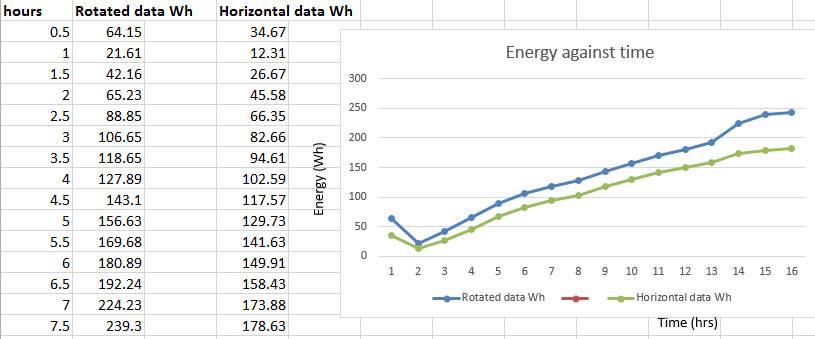
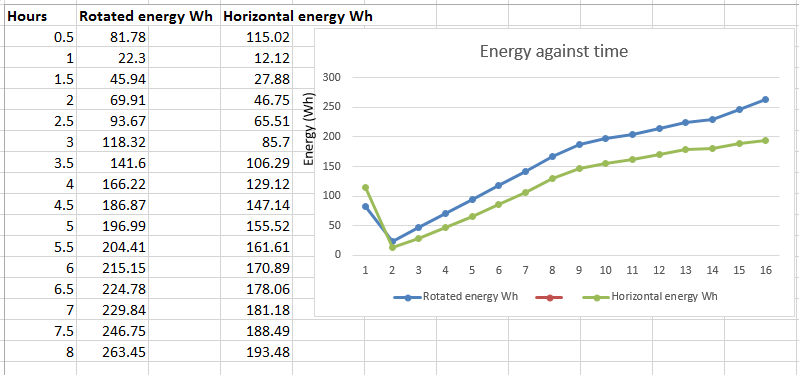
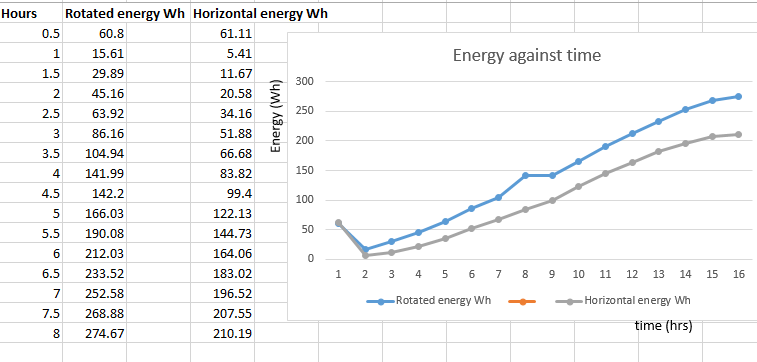
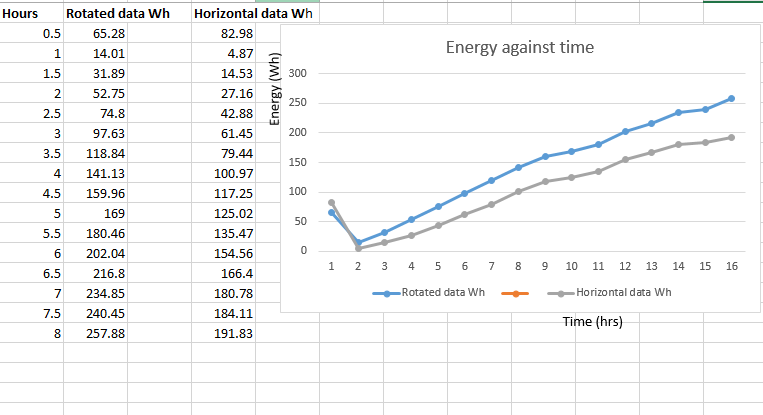
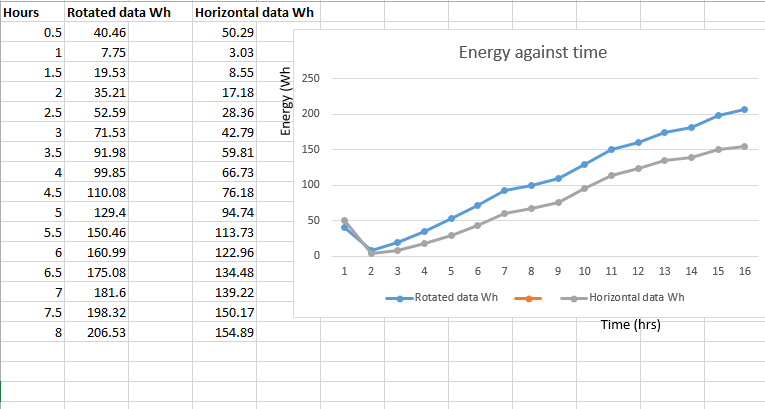
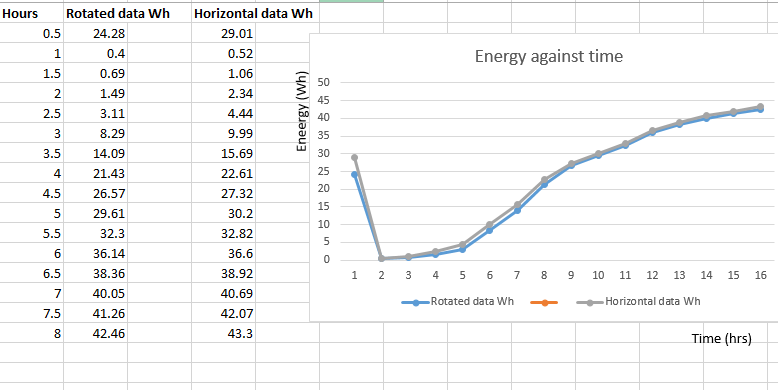
7 shows average energy collected against time in hours for each day of data collection. In the first hour, there is a fall in the energy collected. This is the time when the solar panel is just set and has not yet accumulated more energy. In the second hour, the energy collected increases with time, but it is observed that the energy collected from tracked solar panel is always higher than that of the horizontal solar panel.
3.3.1 Daily energy output
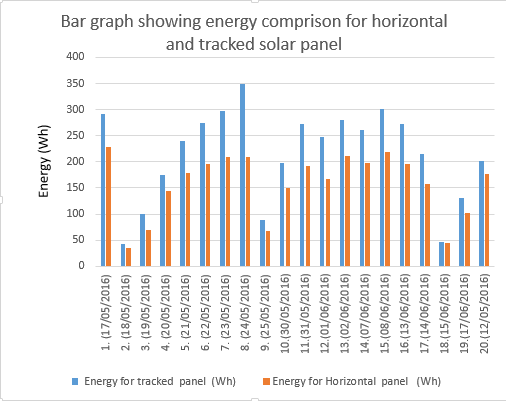
8 compares the two energies collected from the tracked and horizontal solar panel against the day. From the chart, we observe that the total energy collected from both the tracked and horizontal solar panel is highest on 24/05/2016 but with that of the tracked solar panel higher than that of the horizontal solar panel. This is due to the fact that it was a clear day with bright sun and tracking was effective. On 18/05/2016, this was a day when the total energy collected from both panels was almost the same. The same effect is observed on 25/06/2016, but this time both panels gave equal amounts of energy collected because these were cloudy days. This is due to the fact that such days were thick cloudy days with less bright sun. On such days, tracking is not necessary as it is not effective because there is no sunlight to track because of cloudy weather. In general from the Figure 4.8 shows that one can collect more amounts of energy using the constructed solar tracker compared to using a horizontal solar panel as tracked energy is always higher than for horizontal solar panel
3.3.2 Energy output percentage variations
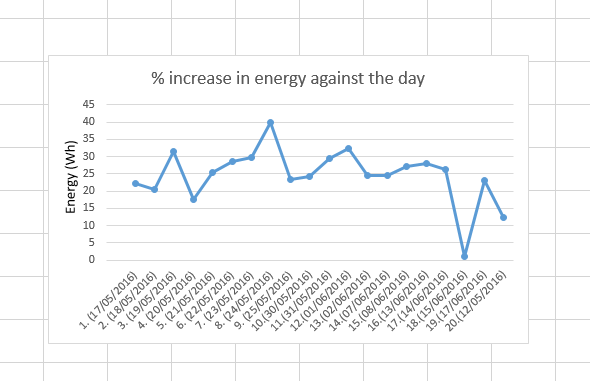
The graph above shows the fractional percentage increase in energy against the day for twenty days. It compares the energy collected from the tracked and horizontal solar panels.
The energy output of the tracked module was generally higher than that of the fixed module. The highest amount of energy equivalent to 348.2274 Wh was recorded for a fixed solar tracker whereas for the horizontally oriented solar tracker, 209.6784 Wh was recorded giving the highest fractional percentage increase of 39.8 %. This was a day of clear sun with the highest intensity for the bright sun.
On 15/06/16, the lowest amount of energy equivalent to 45.5599 Wh from the rotated solar panel was recorded while 45.05927 Wh was recorded for a horizontally oriented solar panel. The lowest fractional percentage energy increase of 1.1 % was noticed. Both panels recorded almost the same energy outputs. This could be due to the fact that the day had a thick cloudy day with less bright sun exposed to the solar panels throughout the day. It was found out that the total energy for 20 days from a tracked solar panel was greater than that collected from the same solar panel if it were horizontally oriented. Energy collected from a rotating solar panel was added for all the 20 days and totaled to 4286.9564 Wh and that from the same solar cell when horizontally oriented was also computed for the same number of days and totaled to 3150.8132 Wh. These two when compared give a fractional energy increase equivalent to 0.2650 and when expressed in percentage gave 26.5% increase. Thus tracking is important as it increases energy output by 26.5 % using the constructed solar tracker
3.3.3 Long term data comparison
| Day of the month | Energy for tracked panel ER(Wh) | Energy for Horizontal panel EH (Wh) | Difference ER-EH(Wh) | % increase |
| 1. (17/05/2016) | 292.5345 | 227.5198 | 65.0147 | 22.2 |
| 2. (18/05/2016) | 43.2313 | 34.3674 | 8.8639 | 20.5 |
| 3. (19/05/2016) | 100.6491 | 68.939267 | 31.709833 | 31.5 |
| 4. (20/05/2016) | 174.6948 | 143.7857 | 30.9091 | 17.7 |
| 5. (21/05/2016) | 239.959125 | 178.855396 | 61.103729 | 25.5 |
| 6. (22/05/2016) | 275.365422 | 196.222604 | 79.142818 | 28.7 |
| 7. (23/05/2016) | 298.065394 | 209.338875 | 88.726519 | 29.8 |
| 8. (24/05/2016) | 348.2274 | 209.6784 | 138.549 | 39.8 |
| 9. (25/05/2016) | 88.23571 | 67.49549 | 20.74022 | 23.5 |
| 10.(30/05/2016) | 197.0227 | 149.4446 | 47.5781 | 24.2 |
| 11.(31/05/2016) | 271.7216 | 191.5369 | 80.1847 | 29.5 |
| 12.(01/06/2016) | 247.7279 | 167.5932 | 80.1347 | 32.4 |
| 13.(02/06/2016) | 280.8088 | 211.7758 | 69.033 | 24.6 |
| 14.(07/06/2016) | 261.2917 | 197.3108 | 63.9809 | 24.5 |
| 15.(08/06/2016) | 301.9945 | 219.7254 | 82.2691 | 27.2 |
| 16.(13/06/2016) | 272.2452 | 196.3927 | 75.8525 | 27.9 |
| 17.(14/06/2016) | 215.128 | 158.3633 | 56.7647 | 26.4 |
| 18.(15/06/2016) | 45.55993 | 45.05927 | 0.50066 | 1.1 |
| 19.(17/06/2016) | 131.4503 | 101.0575 | 30.3928 | 23.1 |
| 20.(12/05/2016) | 201.04330 | 176.3508 | 24.6925 | 12.3 |
| Total energy for 20days | ∑ER=4286.9564 ∑ER2 = 1071909.3321 | ∑EH=3150.8132 ∑EH2= 567368.2601 | Average % = 26.5 |
The value calculated for t x 2 .Assuming a significance level of 0.05 and 38 degrees of freedom, the critical value is 2.1 and the value of t is above this critical. This reflects an increase in the amount of energy produced from a tracked solar panel compared to a horizontally oriented solar panel.
Conclusions and recommendations
4.1 Conclusions
In this study a mechanical solar tracker was designed, constructed and its performance evaluated. Comparisons of the amount of energy produced from both the tracked and horizontal solar panels on hourly, daily and over a period of 20 days were investigated. The constructed solar tracker resulted in an overall increase in the amount of energy produced compared to the horizontal panel.
4.2 Recommendations
The mechanical solar tracking system was constructed and operationalized at a small scale but the design can be applied to any solar energy system at a large scale.
The instrument needs to be tested and operated in different rural areas of Uganda to determine how well this tracking system performs compared to systems with fixed mounting methods commonly used.
References
- African Development Bank, Uganda (September, 2015). Uganda rural electricity access project; ONEC Department, Retrieved from DOI ↗ Google Scholar ↗
- Boneya, G. (2011). Design of a Photovoltaic-Wind Hybrid power generation system for Ethiopian remote area. M.Sc. thesis, Addis Ababa University. Retrieved from www.sciencedirect.com/science/article/pii/S187661021104584X DOI ↗ Google Scholar ↗
- Bradford Travis (2006) “Solar Revolution” The Economic Transformation of the Global Energy Industry. MIIT Press DOI ↗ Google Scholar ↗
- Chiguvare, Z. &Chiguvare, T.M. (2016). The state of renewable energy technologies and applications in sub-Saharan Africa. Retrieved from https://es.scribd.com/document/313427561/Book-Energy-Security Google Scholar ↗
- Deepthi, S., Ponni, A., Ranjitha, R., &Dhanabel, R., (2013).Comparison of efficiencies of single-axis tracking system and dual-axis tracking system with fixed mount. International Journal of Engineering Science and Innovative Technology, 2(2). Retrieved from http://www.ijesit.com/Volume%202/Issue%202/IJESIT201302_66.pdf DOI ↗ Google Scholar ↗
- Eldin, S.A.S., Abd-Elhady, M.S., Kandil, H.A. (2016). Feasibility of solar tracking systems for PV panels in hot and cold regions. Renewable Energy, volume85, 228–233. Retrieved from http:// DOI ↗ Google Scholar ↗
- Energy, M. O. F., (2014). Ministry of energy and mineral development annual report 2014. Retrieved from www.energyandminerals.go.ug/downloads/AR2014finally.pdf DOI ↗ Google Scholar ↗
- Gardener T Rusike., (2014) African development bank. Retrieved from http://afdb-org.jp/file/rating/standard_poor2014.pdf DOI ↗ Google Scholar ↗
- Green, M. A. (2002). Photovoltaic principles. In Physica E: Low-Dimensional Systems and Nanostructures14(11-17). Retrieved from http:// DOI ↗ Google Scholar ↗
Appendix
1: Raw data
Day one: 17/05/2016
Day two: 18/05/2016
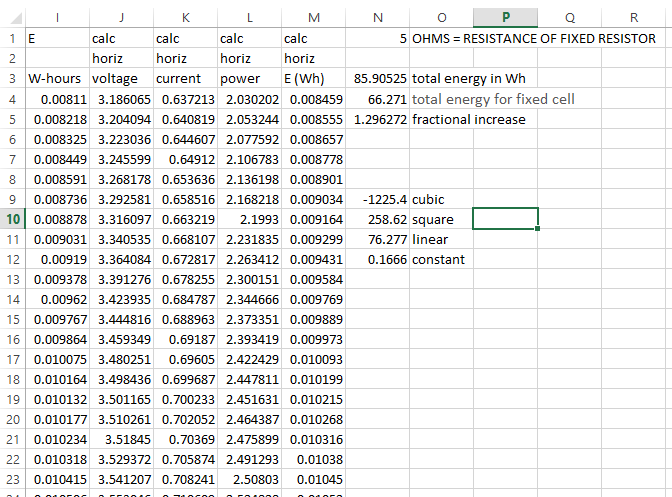
Day three: 19/05/2016
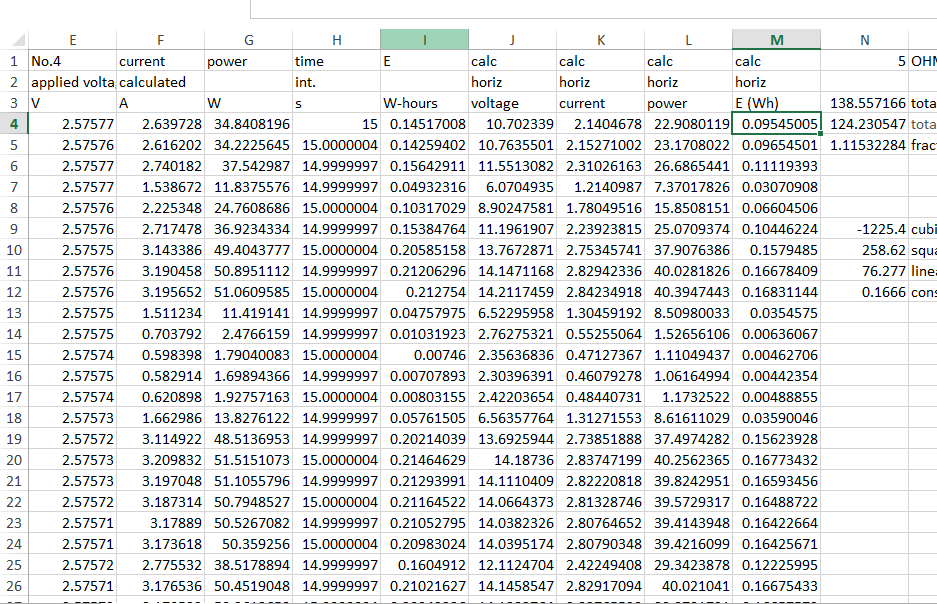
Day four: 20/05/2016
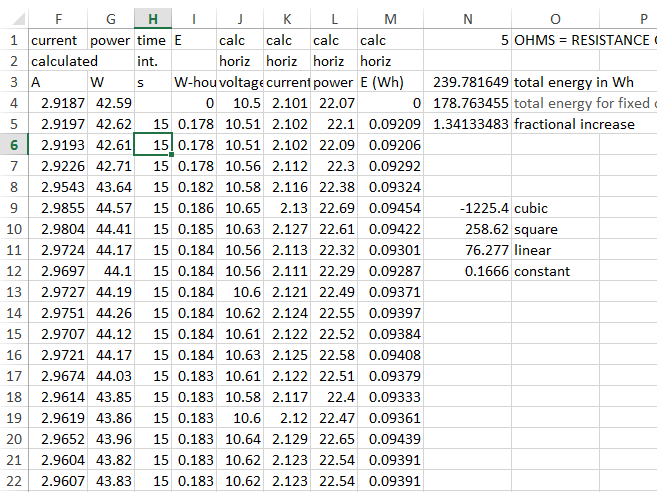
Day five: 21/05/2016
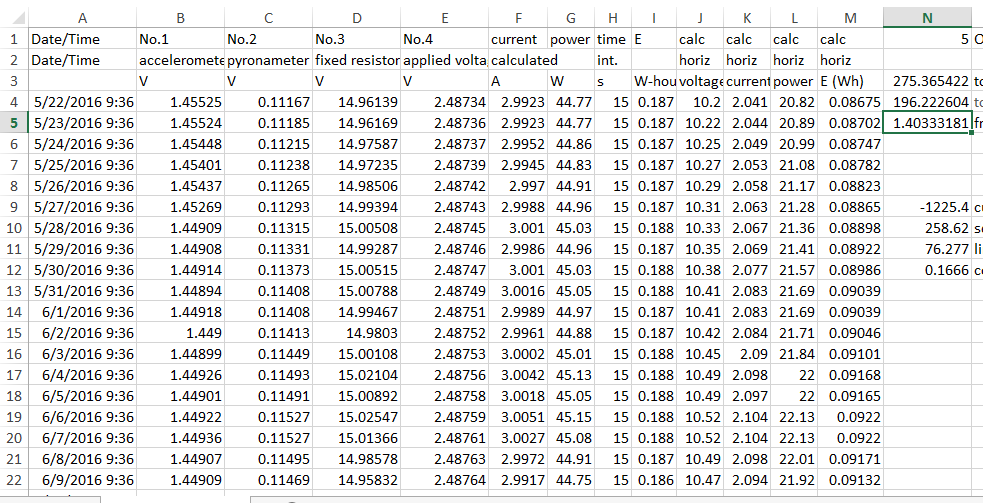
Day six: 22/05/2016
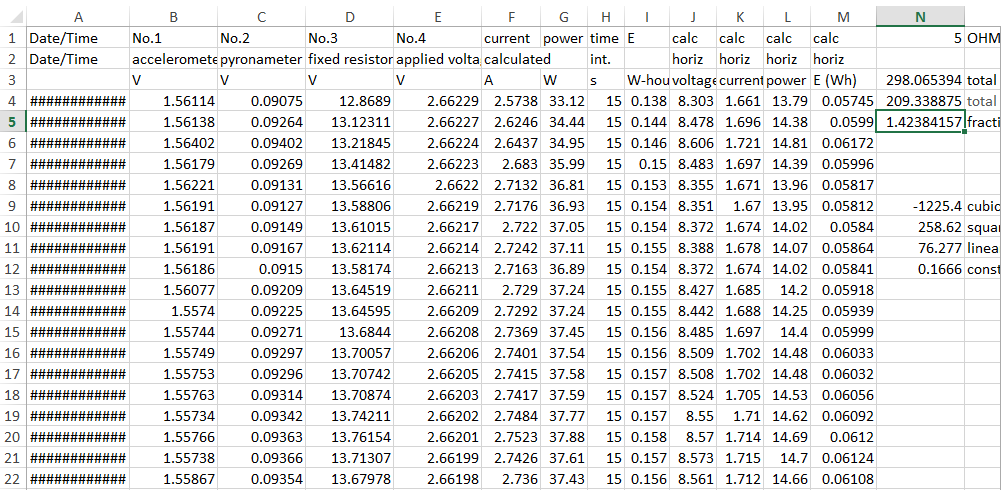
Day seven: 23/05/2016
Day eight: 24/05/2016
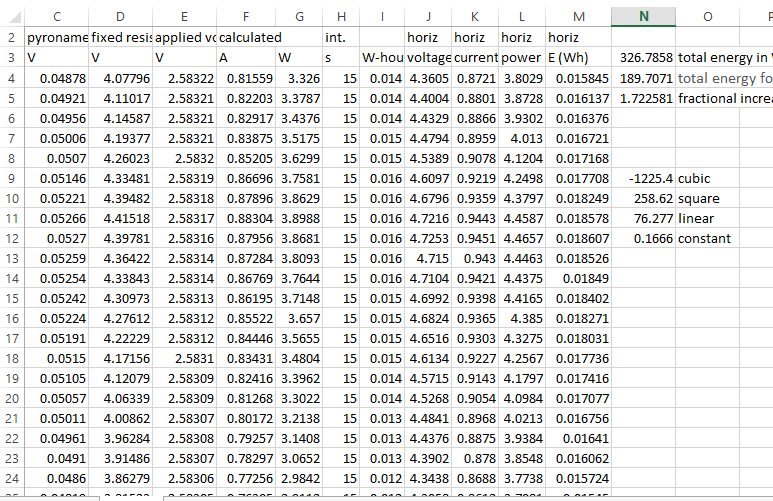
Day nine: 25/05/2016
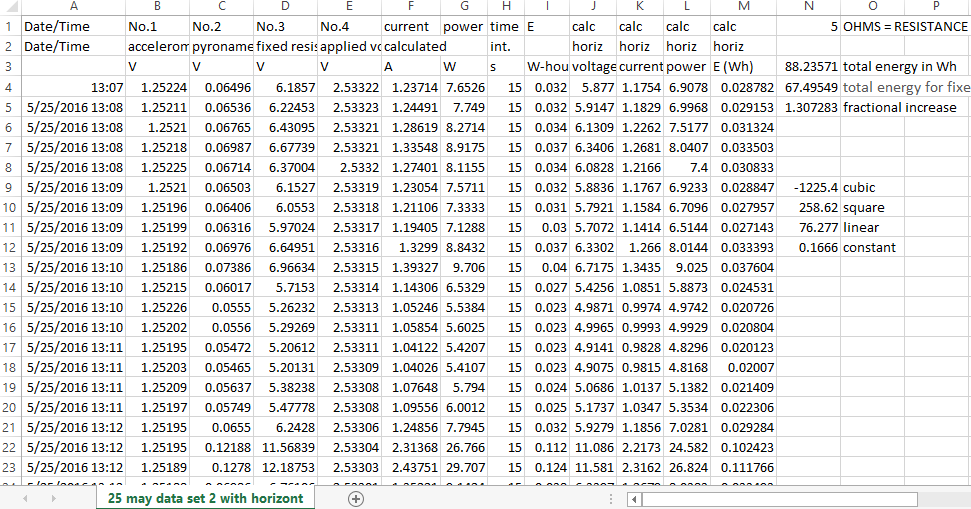
Day ten: 30/05/2016
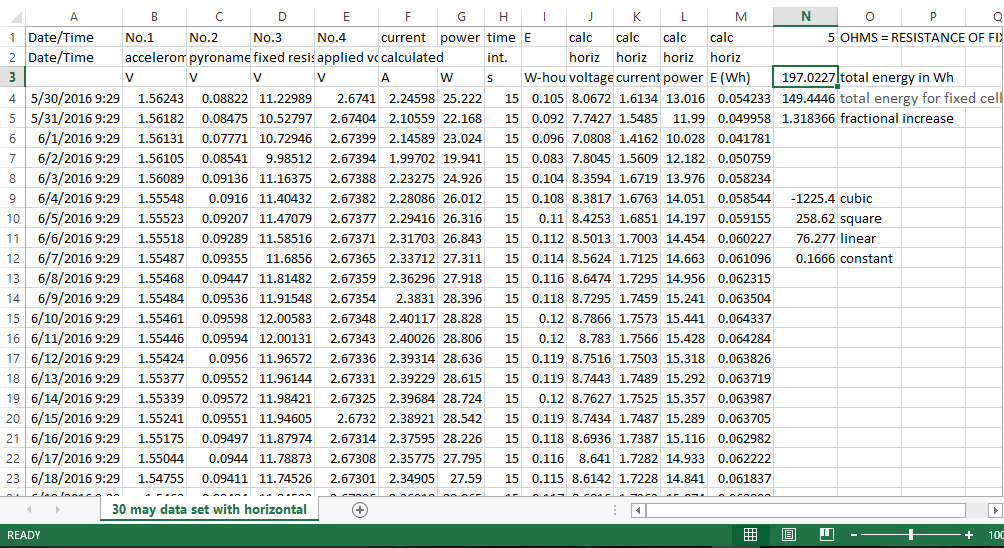
Day eleven: 31/05/2016
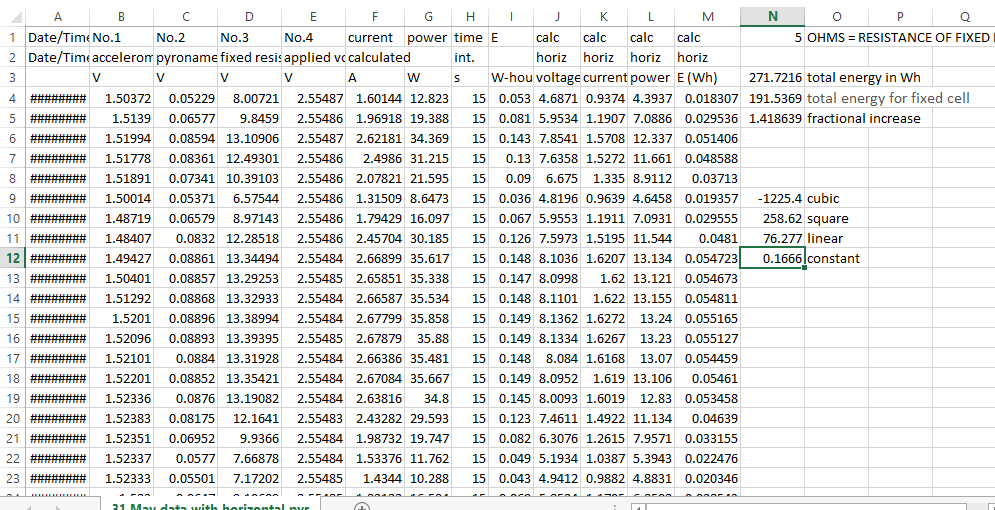
Day twelve: 01/06/2016
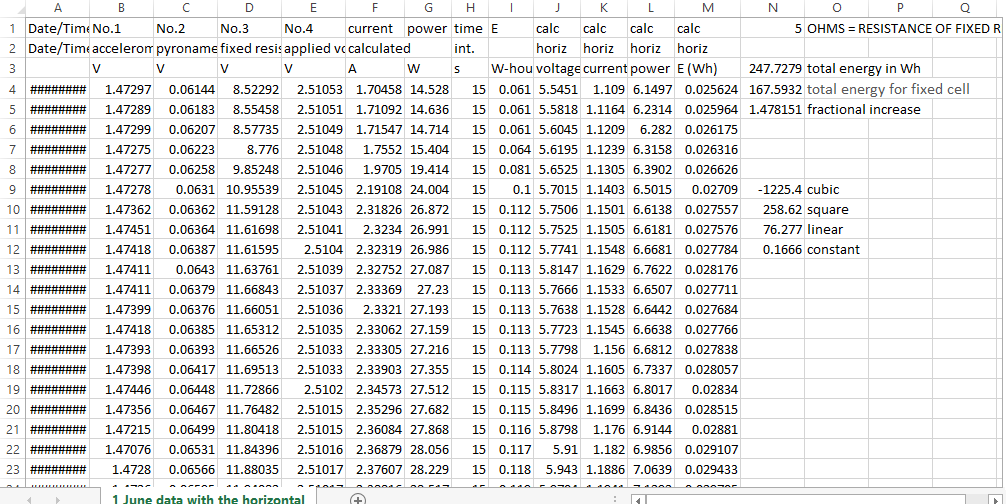
Day thirteen: 02/06/2016
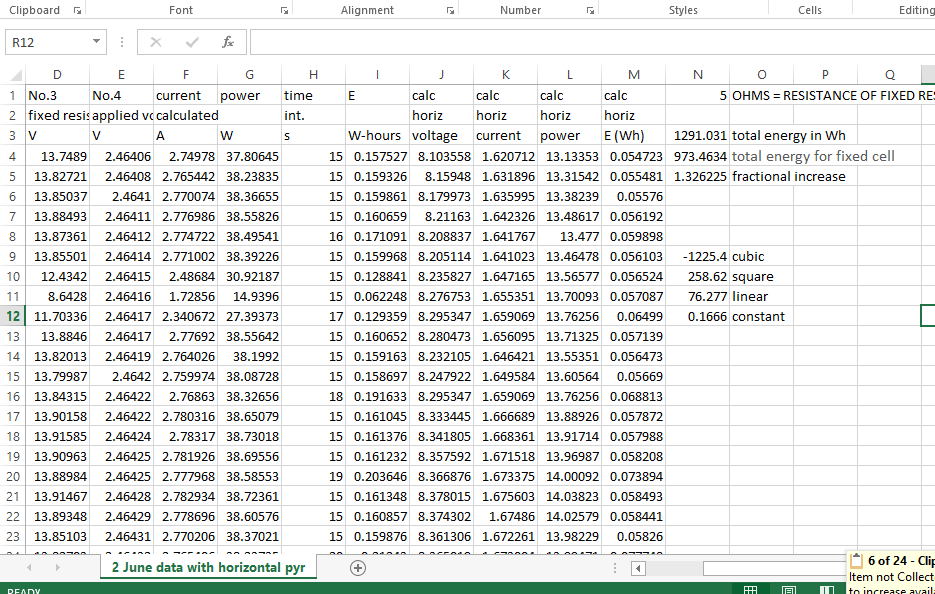
Day fourteen: 07/06/2016
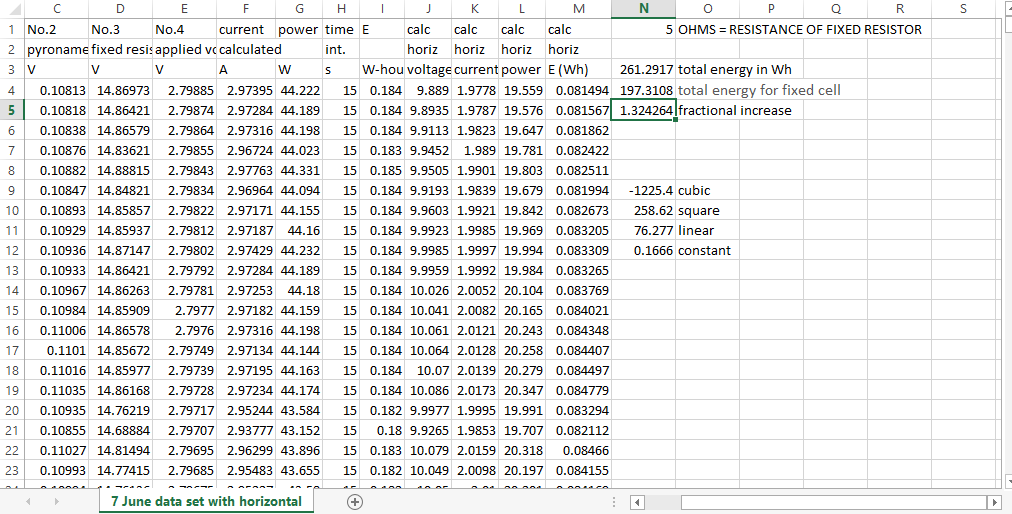
Day fifteen: 08/06/2016
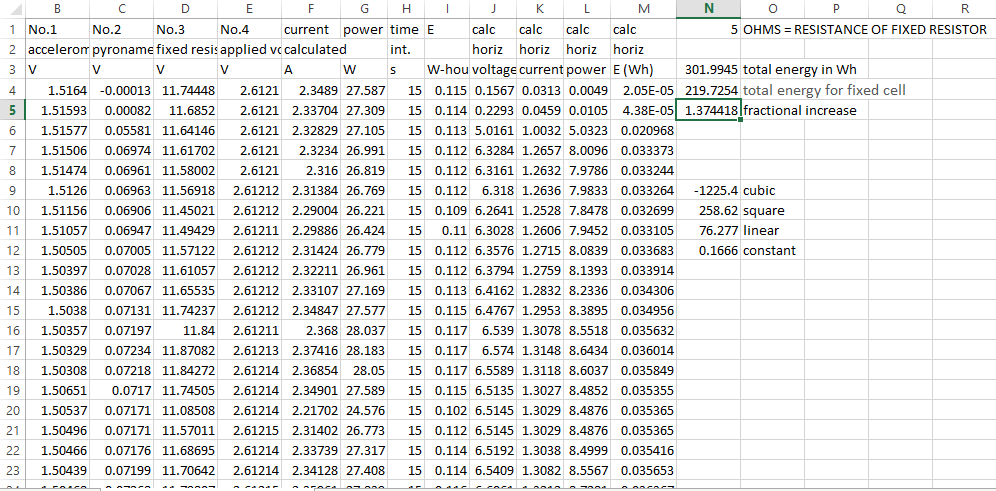
Day sixteen: 13/06/2016
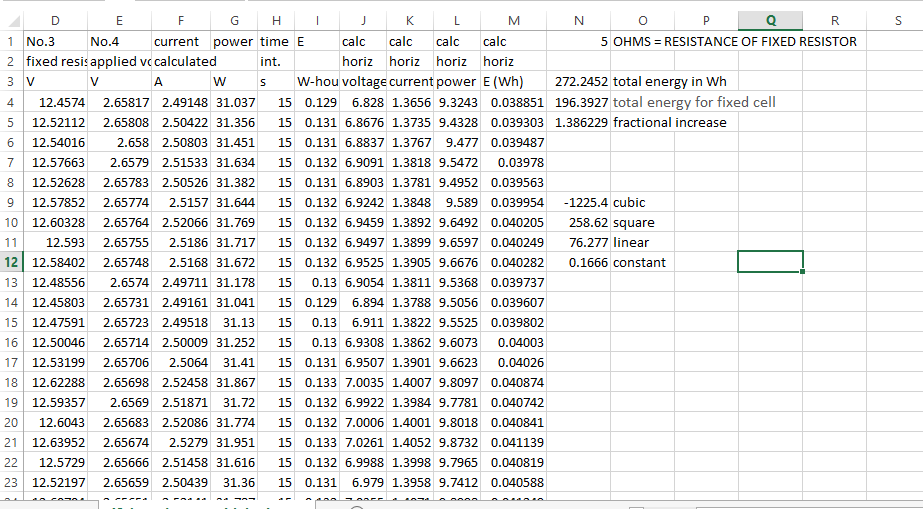
Day seventeen: 14/06/2016
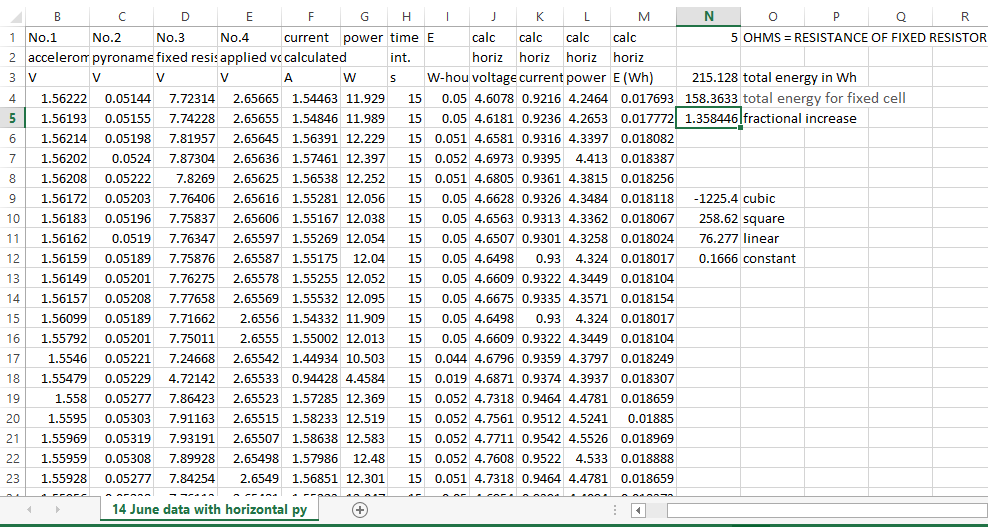
Day eighteen: 15/06/2016
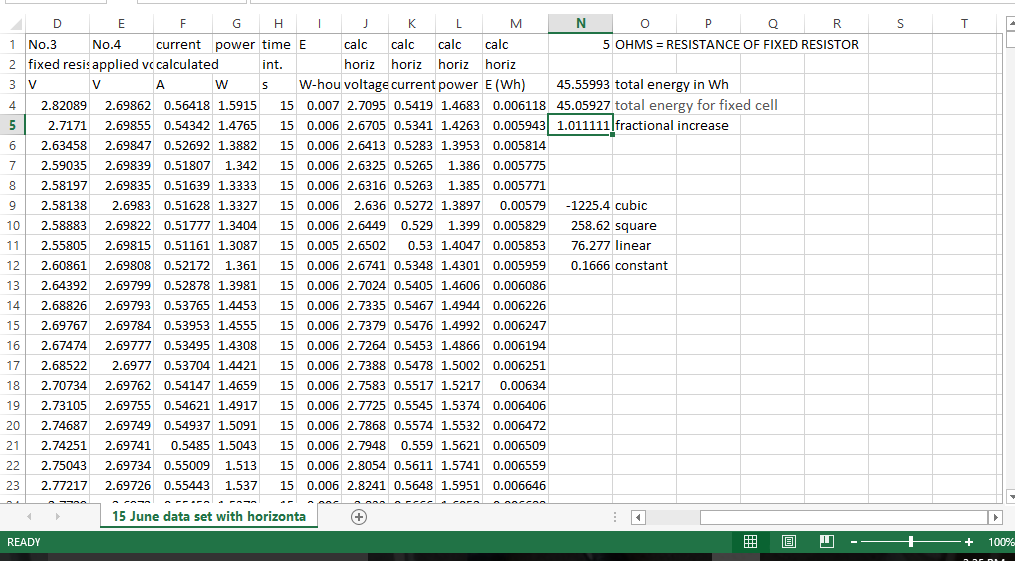
Day nineteen: 17/06/2016
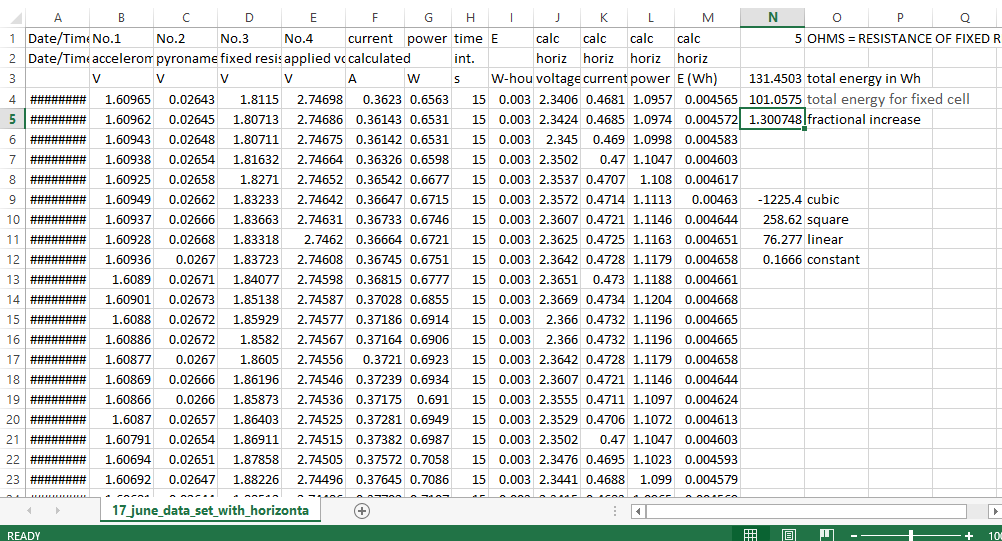
Day twenty:
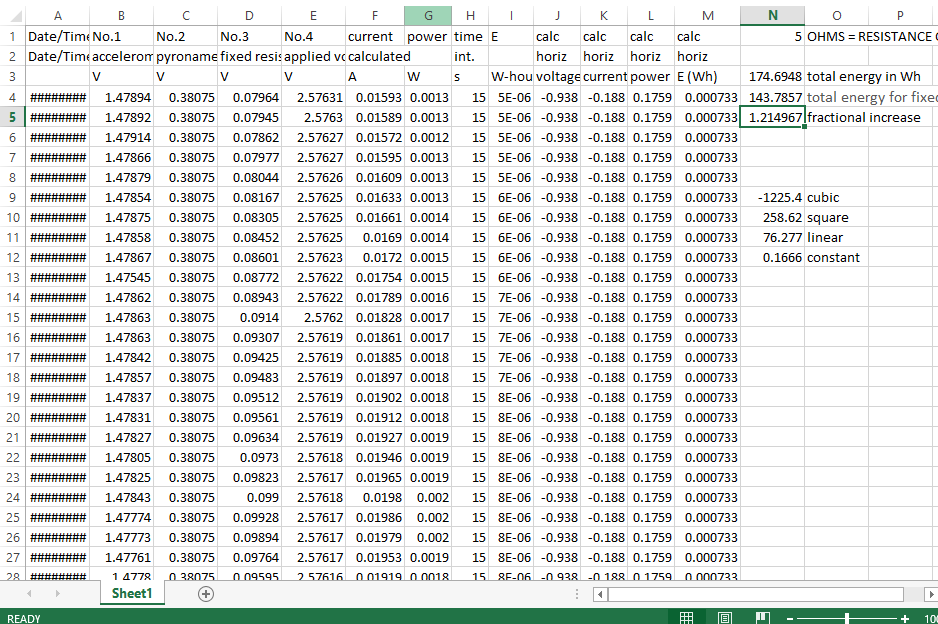
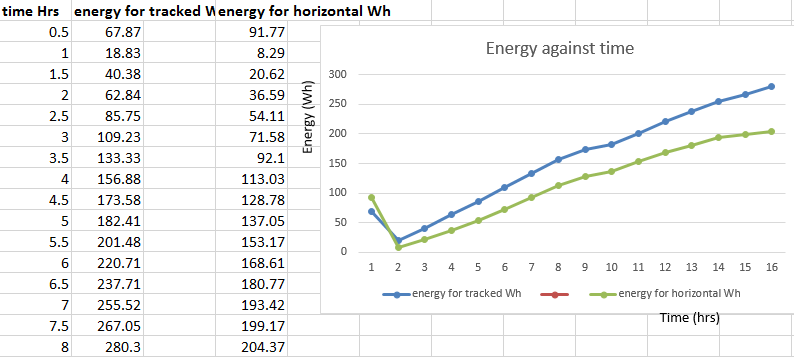
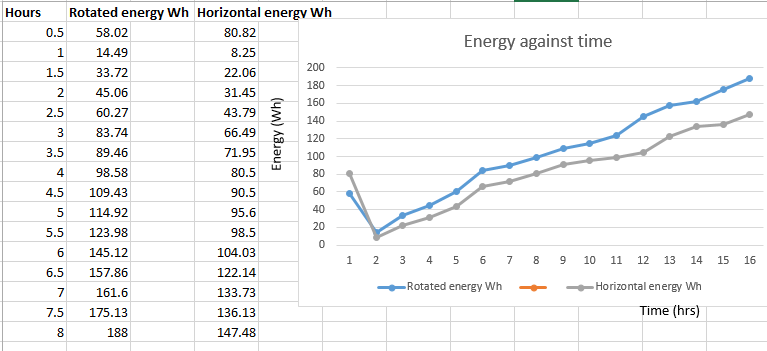
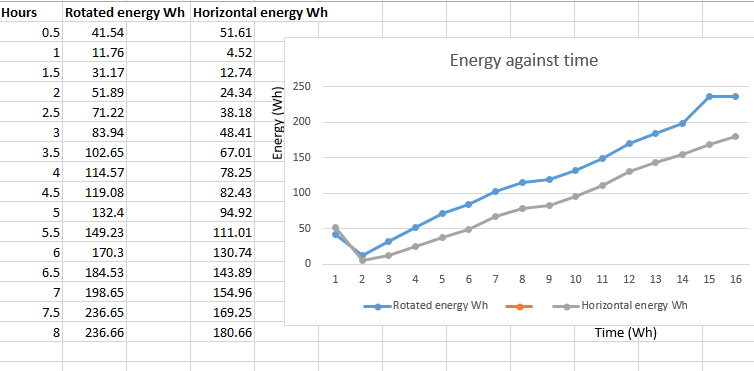
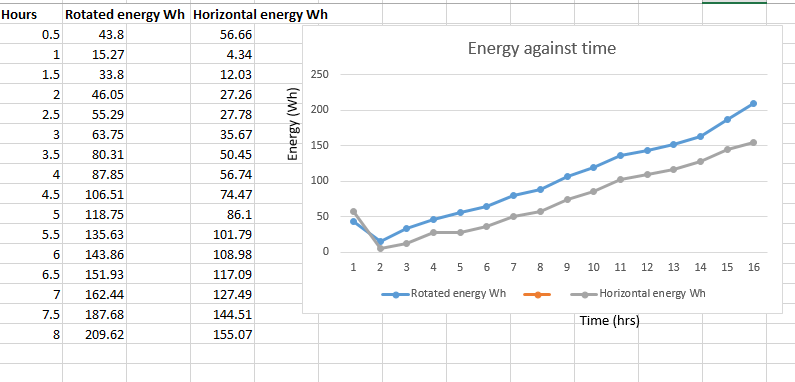
| Day of the month | Energy for tracked panel ER(Wh) | Energy for Horizontal panel EH (Wh) | Difference ER-EH(Wh) | % increase |
| 1. (17/05/2016) | 292.5345 | 227.5198 | 65.0147 | 22.2 |
| 2. (18/05/2016) | 43.2313 | 34.3674 | 8.8639 | 20.5 |
| 3. (19/05/2016) | 100.6491 | 68.939267 | 31.709833 | 31.5 |
| 4. (20/05/2016) | 174.6948 | 143.7857 | 30.9091 | 17.7 |
| 5. (21/05/2016) | 239.959125 | 178.855396 | 61.103729 | 25.5 |
| 6. (22/05/2016) | 275.365422 | 196.222604 | 79.142818 | 28.7 |
| 7. (23/05/2016) | 298.065394 | 209.338875 | 88.726519 | 29.8 |
| 8. (24/05/2016) | 348.2274 | 209.6784 | 138.549 | 39.8 |
| 9. (25/05/2016) | 88.23571 | 67.49549 | 20.74022 | 23.5 |
| 10.(30/05/2016) | 197.0227 | 149.4446 | 47.5781 | 24.2 |
| 11.(31/05/2016) | 271.7216 | 191.5369 | 80.1847 | 29.5 |
| 12.(01/06/2016) | 247.7279 | 167.5932 | 80.1347 | 32.4 |
| 13.(02/06/2016) | 280.8088 | 211.7758 | 69.033 | 24.6 |
| 14.(07/06/2016) | 261.2917 | 197.3108 | 63.9809 | 24.5 |
| 15.(08/06/2016) | 301.9945 | 219.7254 | 82.2691 | 27.2 |
| 16.(13/06/2016) | 272.2452 | 196.3927 | 75.8525 | 27.9 |
| 17.(14/06/2016) | 215.128 | 158.3633 | 56.7647 | 26.4 |
| 18.(15/06/2016) | 45.55993 | 45.05927 | 0.50066 | 1.1 |
| 19.(17/06/2016) | 131.4503 | 101.0575 | 30.3928 | 23.1 |
| 20.(12/05/2016) | 201.04330 | 176.3508 | 24.6925 | 12.3 |
| Total energy for 20days | ∑ER=4286.9564 ∑ER2 = 1071909.3321 | ∑EH=3150.8132 ∑EH2= 567368.2601 | Average % = 26.5 |
Measurement of voltage applied, voltage along z axis and calculation of the tracking angle
Table shows records of the measured rotational heights at opposite sides of a rotating solar panel. These were used to calculate rotational angle at different times as panel rotates.
| Time | V battery | Vx | Vy | Vz | Height | Angle | Height | angle |
| Level | 2.664 | 1.655 | 1.293 | 1.34 | ||||
| solar noon | 2.664 | 1.625 | 1.168 | 1.34 | 23.1 | 20.33 | ||
| 9:15 AM | 2.663 | 1.492 | 1.155 | 1.601 | 57 | 51.658 | ||
| 9:27 AM | 2.662 | 1.526 | 1.156 | 1.571 | 49.5 | 42.932 | ||
| 10:02 AM | 2.66 | 1.544 | 1.156 | 1.545 | 45 | 38.258 | ||
| 10:33 AM | 2.659 | 1.575 | 1.158 | 1.502 | 36 | 29.694 | ||
| 10:56 AM | 2.658 | 1.584 | 1.158 | 1.477 | 30.9 | 25.162 | ||
| 11:27 AM | 2.656 | 1.597 | 1.159 | 1.45 | 24 | 19.283 | ||
| 11:54 AM | 2.655 | 1.602 | 1.158 | 1.429 | 19.5 | 15.564 | ||
| 11:57 AM | 2.654 | 1.608 | 1.16 | 1.41 | 14 | 11.107 | ||
| 12:30 PM | 2.652 | 1.616 | 1.162 | 1.346 | 3 | 2.3659 | ||
| 12:57 PM | 2.651 | 1.615 | 1.16 | 1.337 | 0 | 0 | ||
| 1:29 PM | 2.647 | 1.615 | 1.164 | 1.303 | -5 | -3.9451 | ||
| 2:50 PM | 2.642 | 1.582 | 1.171 | 1.179 | -32 | -26.124 | ||
| 3:21 PM | 2.641 | 1.561 | 1.172 | 1.135 | -41 | -34.344 | ||
| 4:45 PM | 2.633 | 1.483 | 1.176 | 1.057 | -58.5 | -53.607 | ||
| 5:23 PM | 2.631 | 1.428 | 1.178 | 1.019 | -66 | -65.253 | ||
| solar noon | 2.628 | 1.603 | 1.154 | 1.324 | ||||
| Level | 2.628 | 1.632 | 1.276 | 1.328 | ||||
| Ch1 = Vz, Ch2 = pyranometer, Ch3 = solar cell, Ch4 = applied voltage | ||||||||
| The rotation angle is measured by holding the bar horizontal and touching the higher corner of the PV cell. |
2: Design diagrams
3.3.1 A metallic frame stand is welded and assembled as shown below.
3.3.2 A set of clamps was made by welding and attaching 13 inch bolts.
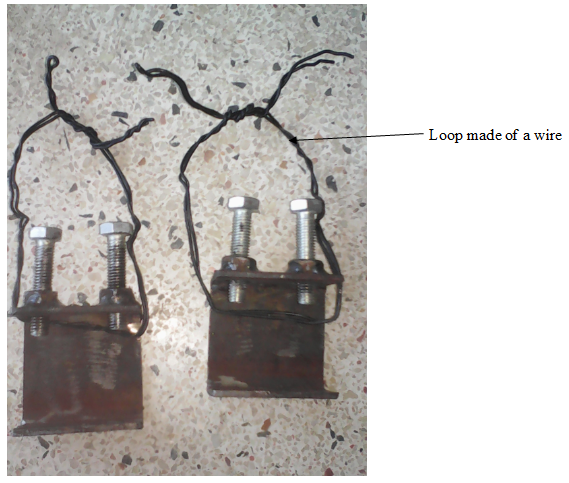
3.3.3 Set of clamps with loop of wire
3.3.4 The top of the stand with a bolt.
3.3.5 Part of the apparatus that shows attachment of container filled with water together with measuring cylinder.
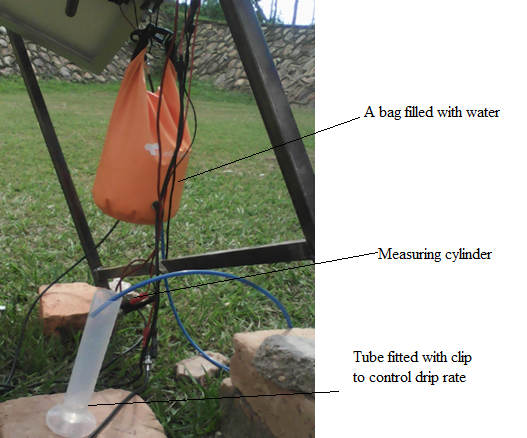
3.3.6 Assembling of the accelerometer
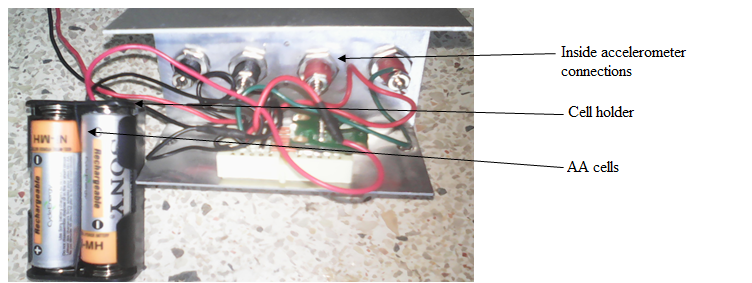
3.3.7 Experiment used to test the assembled accelerometer before mounting it on solar panel
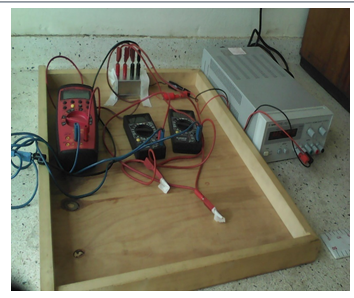
3.3.8 Attaching a 5 Ω resistor onto the terminals of a solar cell