Abstract
The emergence of coffee products has intensified competition and created a need to understand how product innovation shapes purchase intentions by gender. This study aimed to examine the effect of product innovation on purchase intention toward coffee products, determine whether purchase intention differs between male and female students, and assess whether gender moderates the relationship between product innovation and purchase intention. A quantitative research design involved 97 students in Mataram City, consisting of 49 male and 48 female respondents. Data were collected using a questionnaire containing 13 items measured on a five-point Likert scale, comprising seven Product Innovation indicators and six Purchase Intention indicators. Data were analyzed using descriptive statistics, simple linear regression, an independent-samples t-test, and moderated regression analysis. The results showed that Product Innovation had a positive and significant effect on Purchase Intention (B = 0.696, β = 0.628, p < 0.001), explaining 39.400% of the variance in Purchase Intention (R² = 0.394). Purchase Intention did not differ between male and female respondents (p = 0.188), although males reported a higher mean (75.310) than females (72.360). The Product Innovation × Gender interaction was not significant (B = 0.216, p = 0.227), indicating no moderating effect. The study concludes that product innovation is a predictor of Purchase Intention, whereas gender does not differentiate or moderate this relationship. The findings suggest that businesses should prioritize product innovation, while research should consider consumer innovativeness, perceived quality, social influence, and digital engagement.
Keywords
Product Innovation Purchase Intention Gender Coffee Products
1. Introduction
Coffee has become a highly established consumer product with a broad global market and increasingly diverse consumption patterns. More than 1.6 billion cups of coffee are consumed worldwide each day, while specialty coffee consumption has generated changes in consumer preferences, consumption frequency, and behavioral intentions (Merwe & Maree, 2016). In Indonesia, coffee consumption is also increasingly visible among urban consumers and young adults. A recent study among office workers in Jakarta reported that 47.1% of 121 participants were daily coffee drinkers, with an average consumption of 247 mL per day, indicating the continuing relevance of coffee in everyday consumption patterns (Herqutanto et al., 2024). These developments indicate that coffee is no longer consumed merely as a conventional beverage but has become part of a broader consumer lifestyle, making consumer purchase intention an important issue for coffee businesses.
The development of the coffee market is accompanied by increasingly diverse product forms, preparation methods, sensory characteristics, and consumption experiences. In Indonesia, manual-brew methods such as V60, tubruk, and cold brew have become increasingly visible among urban and millennial consumers because differences in brewing methods provide distinctive taste and aroma experiences (Afif & Fithriya, 2024). From an international perspective, coffee choice is also affected by the multisensory context surrounding consumption, including visual, auditory, olfactory, and tactile elements that can influence perception and consumer choice (Spence & Carvalho, 2020). Such developments create stronger competition among coffee products and require producers to introduce meaningful product innovations that correspond to changing consumer preferences. For young consumers, particularly university students, the emergence of new coffee products therefore creates an important context for examining whether product innovation can stimulate purchase intention and whether this response differs between male and female consumers.
Previous empirical research provides evidence that product innovation can influence consumers' responses toward products. (Kijek et al., 2020), using data from 315 millennial buyers, found that browsing innovative products and sharing information about them through social media were associated with purchase intention, demonstrating the importance of innovation-related information in consumer decision processes. Similarly, Rayi & Aras (2021) analyzed 96 millennials in Greater Jakarta, consisting of 63 women and 33 men, using PLS-SEM and found that product innovation significantly influenced purchasing decisions, although motivation did not significantly moderate this relationship. Research specifically related to coffee products also provides consistent evidence. Riandi (2024), based on 213 Kopi Kenangan consumers in Samarinda, reported that product innovation had a positive and significant effect on both purchase intention and purchase decision, while purchase intention also significantly influenced purchase decision. Hafizza et al. (2026) using 100 Cafe Ribian consumers and multiple linear regression, similarly found that product innovation had a positive and significant effect on coffee purchasing decisions. More recently, Gusti & Khatimah (2026) reported that product innovation had a positive and significant effect on purchase intention, with a path coefficient of 0.312, while product innovation and discounts jointly explained 52.2% of the variance in purchase intention (R² = 0.522).
Research concerning coffee purchase intention also demonstrates that consumer intention is shaped by several product, psychological, social, and situational factors. Ut-Tha et al. (2021) examined 727 coffee consumers in Thailand using confirmatory factor analysis and structural equation modeling and found that self-identity strongly influenced attitude, while attitude was the strongest determinant of purchase intention; perceived trustworthiness also had a positive direct effect on purchase intention. In Indonesia, Wibowo et al. (2022) investigated 500 coffee consumers in Jakarta and found that attitude (β = 0.79, t = 6.33, p < .001), subjective norms (β = 0.10, t = 2.33, p = .01), and perceived behavioral control (β = 0.38, t = 5.60, p < .001) significantly affected organic coffee purchase intention. Syahputra et al. (2021) examined 100 young Indonesian consumers using path analysis and reported that the components of the Theory of Planned Behavior significantly affected coffee purchase decisions. Candra et al. (2022) found that sensory experience influenced positive and negative emotions, while these emotional responses subsequently affected behavioral intentions among coffee-shop visitors. Shim et al. (2021) using 474 valid observations and multiple linear regression in the context of Starbucks, found that healthiness, hygiene, quarantine, and ease of application use positively influenced purchase intention, whereas environmental responsibility was not significant. These findings indicate that purchase intention is multidimensional and can emerge from interactions between product attributes, consumer perceptions, social factors, and consumption experiences.
Gender represents another relevant dimension because consumer responses toward coffee are not necessarily homogeneous between men and women. Kim (2019) examined coffee preferences according to gender and age and reported significant differences in coffee preferences across gender groups, suggesting that coffee products and marketing approaches may need to consider gender-based consumer characteristics. In Indonesia, research involving 100 coffee consumers in Banda Aceh found that age, product quality, price, and location significantly affected purchasing decisions, whereas gender did not have a significant effect, indicating that the role of gender may depend on the particular market context and product characteristics. In Taiwan, Wang et al. (2024) investigated Gen-Z consumers through interviews and experimental taste tests and identified a potential gender effect, with female young consumers showing a greater tendency to consume specialty coffee than their male counterparts. A more recent study using Kansei Engineering assessed 42 participants, equally divided into 21 males and 21 females, and found differences in the sensory meanings associated with Robusta coffee: female participants emphasized descriptors such as “aromatic” and “fragrant,” whereas male participants emphasized “comfort” and “spirit.” Among Indonesian university students, Zainuddin & Shujahat (2022) surveyed 619 students in Aceh and found that more male students visited coffee shops than female students, with average visits exceeding three hours per day. These findings suggest that gender can be associated with differences in coffee preference, consumption patterns, and sensory perceptions, although the direction and magnitude of the difference are not necessarily consistent across contexts.
Taken together, previous studies establish two important patterns. First, product innovation is repeatedly associated with consumer purchase intention or purchase decision, including evidence from coffee businesses and young consumers. Second, gender-related differences have been observed in coffee preferences, consumption patterns, and sensory perceptions, but the evidence is context-dependent: some studies identify meaningful gender differences, whereas others report that gender is not a significant predictor of purchasing decisions. A research gap therefore remains in examining these two dimensions simultaneously, particularly by testing whether students' purchase intention toward a new coffee product differs according to gender when product innovation is considered as the principal explanatory factor. Existing studies have generally examined product innovation and purchase intention without explicitly comparing male and female consumers, or have examined gender differences in coffee consumption without directly connecting them to responses toward newly innovated coffee products. The novelty of the present study lies in integrating product innovation, purchase intention, and gender comparison within the specific context of university students in Mataram City. This approach can provide more specific evidence concerning whether product innovation generates a comparable purchase response across gender groups in a local student market.
This study aims to analyze the influence of product innovation on students' purchase intention toward new coffee products and to compare the level of purchase intention between male and female students in Mataram City. The study is expected to contribute empirical evidence concerning consumer responses to coffee-product innovation among young consumers and provide practical information for coffee businesses in developing new products, determining target markets, and designing marketing strategies that are more responsive to the characteristics of student consumers.
2. Method
This study employed a quantitative research design to examine the effect of Product Innovation on Purchase Intention toward new coffee products and to compare Purchase Intention between male and female university students. The study also examined whether gender moderates the relationship between Product Innovation and Purchase Intention. The research was conducted in Mataram City, Indonesia, with a total of 97 university students, consisting of 49 male and 48 female respondents. The research instrument was a structured questionnaire consisting of 13 statements measured using a five-point Likert scale ranging from 1 (Strongly Disagree) to 5 (Strongly Agree). The instrument comprised 7 statements measuring Product Innovation (X) and 6 statements measuring Purchase Intention (Y). The Product Innovation items assessed respondents' perceptions of the novelty, uniqueness, suitability, and innovative characteristics of new coffee products, whereas the Purchase Intention items measured respondents' willingness and intention to purchase new coffee products. The research procedure is as shown in Figure 1.
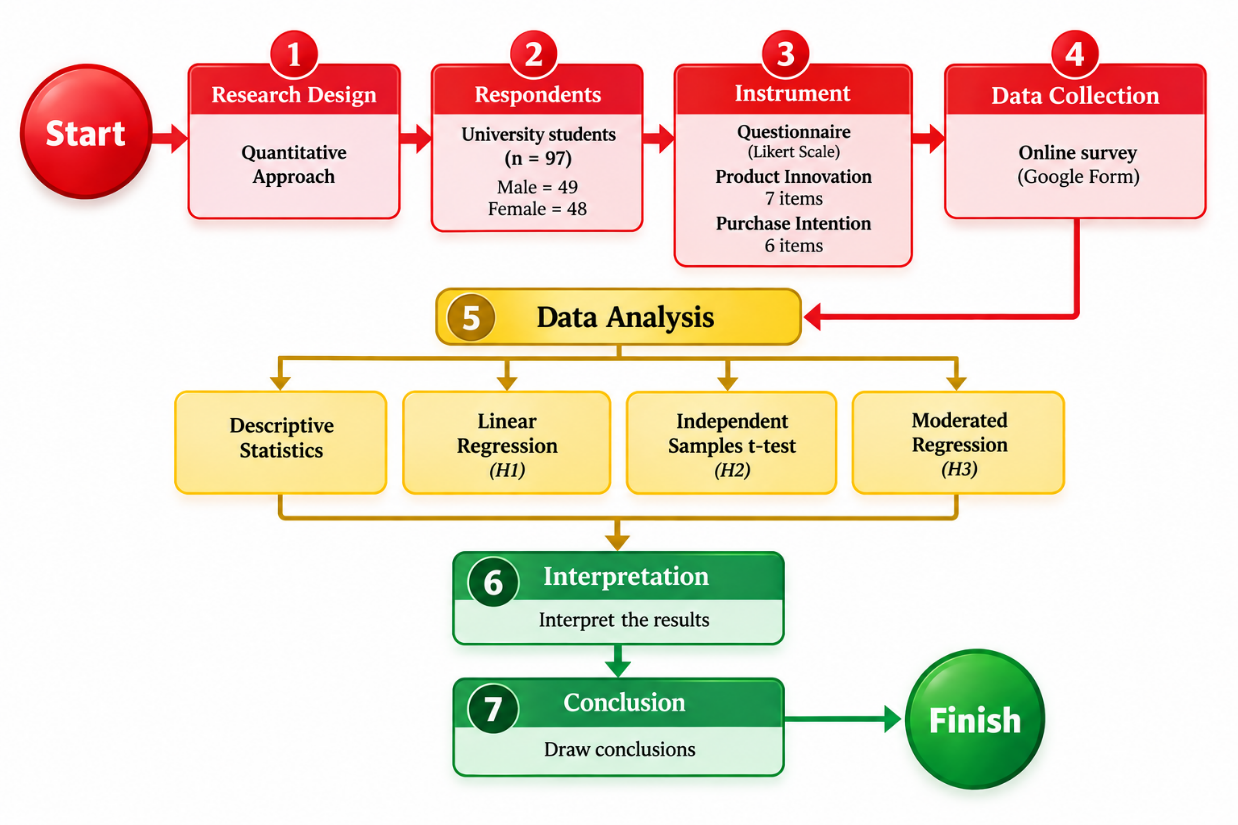
The research procedure consisted of several stages. First, the questionnaire was developed based on the research variables and indicators. Second, data were collected online using Google Forms and distributed to all selected respondents. Third, the collected data were coded and analyzed using descriptive and inferential statistical techniques. The analysis included descriptive statistics, simple linear regression, independent-samples t-test, and moderated regression analysis. Descriptive statistics were used to describe the characteristics of the respondents and the distribution of the research variables. Simple linear regression was used to examine the effect of Product Innovation on Purchase Intention, while the independent-samples t-test was used to examine differences in Purchase Intention between male and female students. Moderated regression analysis was used to test whether gender moderated the relationship between Product Innovation and Purchase Intention.
Three hypotheses were tested in this study. Hypothesis-1 (H1): Product Innovation has a positive effect on Purchase Intention toward new coffee products. H1 was tested using simple linear regression, with the hypothesis supported when the regression coefficient for Product Innovation was positive and statistically significant at the 5% significance level (α = 0.05). Hypothesis-2 (H2): There is a significant difference in Purchase Intention between male and female university students. H2 was examined using an independent-samples t-test, with a significant difference concluded when the p-value was less than 0.05. Hypothesis-3 (H3): Gender moderates the effect of Product Innovation on Purchase Intention. H3 was tested using moderated regression analysis by examining the significance of the Product Innovation × Gender interaction term; a significant interaction (p < 0.05) indicated that the relationship between Product Innovation and Purchase Intention differed according to gender. For all hypotheses, a p-value below 0.05 was considered statistically significant, while a p-value greater than or equal to 0.05 indicated insufficient evidence to support the respective hypothesis. The statistical findings were subsequently interpreted in relation to the research objectives and used as the basis for drawing conclusions from the empirical evidence.
3. Result and Discussion
Descriptive Statistics of Research Variables
Following data collection, all responses were tabulated and screened to ensure completeness, consistency, and compliance with the research criteria. Responses containing anomalies or failing to meet the predetermined criteria were excluded from the analysis. The valid responses were subsequently analyzed to identify the respondents' coffee consumption patterns and their experiences with new coffee products. This preliminary analysis was conducted to provide a contextual overview of the respondents before examining the main research variables.
The results show that milk coffee was the most frequently consumed coffee product, accounting for 19.59% of the responses. It was followed by cappuccino (14.43%), palm sugar coffee (13.40%), Americano (10.31%), vanilla (9.28%), and matcha (8.25%). Other products included butterscotch (7.22%), latte (7.22%), hazelnut (5.15%), caramel (2.06%), espresso (1.03%), macchiato (1.03%), and mocha (1.03%). The distribution indicates that respondents had diverse coffee preferences, although milk-based and flavored coffee products accounted for a relatively large proportion of consumption. This pattern suggests that product characteristics such as flavor variation and the combination of coffee with additional ingredients may be relevant to students' coffee preferences.
A similar pattern was observed in respondents' experiences with new coffee products. Americano and milk coffee were the most frequently recalled products, each accounting for 10.42%, followed by latte (9.38%), Nescafe (8.33%), palm sugar coffee (6.25%), matcha (5.21%), vanilla (5.21%), cappuccino (4.17%), butterscotch (4.17%), and caramel (3.13%). The variety of products recalled by respondents indicates that their exposure to new coffee products was not limited to a single product category. This diversity provides an appropriate context for examining how perceived product innovation may influence purchase intention. Based on these preliminary findings, the respondent characteristics and descriptive statistics of the research variables are presented in Table 1.
| Parameters | X | Y |
| Valid | 97 | 97 |
| Mean (arithmetic) | 74.52 | 73.85 |
| Std. Error of A. Mean | 1.006 | 1.115 |
| Std. Deviation | 9.912 | 10.99 |
| Coefficient of variation | 0.133 | 0.149 |
| Variance | 98.25 | 120.7 |
| Skewness | -0.055 | 0.308 |
| Std. Error of Skewness | 0.245 | 0.245 |
| Kurtosis | -0.533 | -0.535 |
| Std. Error of Kurtosis | 0.485 | 0.485 |
| Shapiro-Wilk | 0.978 | 0.935 |
| P-value of Shapiro-Wilk | 0.095 | < .001 |
| Minimum | 48.57 | 53.33 |
| Maximum | 97.14 | 100 |
Table 1 presents the product innovation obtained a mean score of 74.520 with a standard deviation of 9.912, while Purchase Intention had a mean score of 73.850 with a standard deviation of 10.990. The relatively similar mean scores indicate that respondents generally reported moderately high perceptions of product innovation and purchase intention toward new coffee products. The coefficient of variation was 0.133 for product innovation and 0.149 for Purchase Intention, indicating that the responses were relatively consistent, although Purchase Intention showed slightly greater relative variability. The observed scores ranged from 48.570 to 97.140 for Product Innovation and from 53.330 to 100.000 for purchase intention.
The distributional statistics provide additional information about the characteristics of the data. Product Innovation showed a skewness value of −0.056, indicating an approximately symmetric distribution, whereas Purchase Intention had a positive skewness of 0.308, suggesting a slight concentration of responses toward the higher scores. Both variables had negative kurtosis values, namely −0.533 for Product Innovation and −0.535 for Purchase Intention, indicating relatively flatter distributions compared with a normal distribution. The Shapiro–Wilk test indicated that Product Innovation did not significantly deviate from normality (W = 0.978, p = 0.095). In contrast, Purchase Intention showed a statistically significant result (W = 0.935, p < 0.001), suggesting a departure from normality based on the formal test. However, the skewness and kurtosis values for both variables remained within relatively moderate ranges. Therefore, the distributional characteristics should be considered when selecting and interpreting subsequent inferential analyses. The average student responses for each indicator are shown in Figure 2.
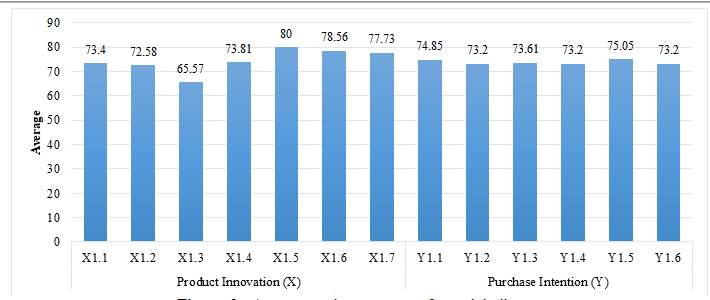
Figure 2 presents the highest mean was observed for interest in trying innovative coffee products (X1.5), with a mean of 80.000. This result was followed by visibility of innovation (X1.6 = 78.560) and recognition of product uniqueness through information or appearance (X1.7 = 77.730). The lowest mean was found for compatibility with students’ lifestyles (X1.3), with a mean of 65.570. The findings indicate that respondents showed stronger responses to the novelty and visibility of coffee innovation than to its compatibility with lifestyle. The relatively high mean for X1.5 also indicates that respondents had a strong interest in trying coffee products that offer new innovations.
Figure 2 also presents the mean scores for the six indicators of Purchase Intention (Y). The highest mean was found for interest in trying new coffee products to assess their quality and taste (Y1.5), with a mean of 75.050. The next highest mean was recorded for intention to purchase attractive new coffee products (Y1.1), at 74.850. The indicators for considering new coffee products as a purchase option (Y1.3) and seeking further information about new coffee products (Y1.4) both obtained a mean of 73.200, while planning future purchases (Y1.6) also obtained 73.200. Overall, the results show that respondents expressed relatively strong trial interest, purchase intention, and product consideration. These findings provide descriptive evidence that respondents’ purchase intentions were present across several stages, from interest and information seeking to consideration and future purchase planning.
Effect of Product Innovation on Purchase Intention
At this stage, the first hypothesis was tested to determine the effect of Product Innovation on Purchase Intention among college students in Mataram. The analysis was conducted using simple linear regression, with Product Innovation as the independent variable (X) and Purchase Intention as the dependent variable (Y). The results of the analysis are presented in Table 2, which shows the model summary and Product Innovation’s ability to explain the variation in Purchase Intention; Table 3, which presents the ANOVA results to test the significance of the regression model as a whole; and Table 4, which presents the regression coefficients to determine the direction, magnitude, and significance of Product Innovation’s effect on Purchase Intention.
| Model | R | R² | Adjusted R² | RMSE | R² Change | F Change | df1 | df2 | p |
| M₀ | 0 | 0 | 0 | 10.99 | 0 | 0 | 96 | ||
| M₁ | 0.628 | 0.394 | 0.388 | 8.597 | 0.394 | 61.74 | 1 | 95 | < .001 |
| Note. M₁ includes X |
Table 2 presents the model produced an R value of 0.628, indicating a positive association between Product Innovation and Purchase Intention. The R² value of 0.394 indicates that Product Innovation explains 39.400% of the variance in Purchase Intention, while the remaining 60.600% is associated with other factors outside the model. The adjusted R² of 0.388 indicates that the explanatory contribution remains 38.800% after adjustment for the model structure. The RMSE decreased from 10.990 in M₀ to 8.597 in M₁, indicating lower prediction error after Product Innovation was included in the model. The R² change of 0.394 and F change of 61.740 with df1 = 1 and df2 = 95 show that the addition of Product Innovation produced a statistically significant improvement in the regression model (p < 0.001). These findings indicate that Product Innovation provides a significant contribution to explaining variation in Purchase Intention. The significance and direction of the individual regression coefficient are presented in Table 3.
| Model | Sum of Squares | df | Mean Square | F | p | |
|---|---|---|---|---|---|---|
| M₁ | Regression | 4563 | 1 | 4563 | 61.74 | < .001 |
| Residual | 7022 | 95 | 73.92 | |||
| Total | 1.159×10+4 | 96 | ||||
| Note. M₁ includes X | ||||||
| Note. The intercept model is omitted, as no meaningful information can be shown. |
Table 3 presents the regression model produced a sum of squares of 4,563.000 with 1 degree of freedom and a mean square of 4,563.000. The residual component had a sum of squares of 7,022.000 with 95 degrees of freedom and a mean square of 73.920, while the total sum of squares was 11,590.000 with 96 degrees of freedom. The resulting F-statistic was 61.740 with a significance value of p < 0.001, indicating that the regression model was statistically significant. This result shows that Product Innovation significantly contributes to the variation in Purchase Intention among the respondents. The ANOVA result therefore provides statistical evidence that the regression model is appropriate for examining the relationship between Product Innovation and Purchase Intention. The direction and magnitude of the effect are further examined through the regression coefficients presented in Table 4.
| Model | Unstandardized | Standard Error | Standardized | t | p | |
|---|---|---|---|---|---|---|
| M₀ | (Intercept) | 73.85 | 1.115 | 66.21 | < .001 | |
| M₁ | (Intercept) | 22.01 | 6.655 | 3.308 | .001 | |
| X | 0.6956 | 0.08853 | 0.6276 | 7.857 | < .001 |
Table 4 presents the regression model (M₁), the intercept was 22.010 with a standard error of 6.655, yielding t = 3.308 and p = 0.001. Product Innovation had an unstandardized coefficient of 0.696 with a standard error of 0.089. The standardized coefficient was β = 0.628, with t = 7.857 and p < 0.001. These results indicate a positive and statistically significant effect of Product Innovation on Purchase Intention. The regression Equation (1):
Y = 22.010 + 0.696X(1)
where Y represents Purchase Intention and X represents Product Innovation. The intercept of 22.010 indicates the estimated Purchase Intention score when Product Innovation is zero. The coefficient of 0.696 indicates that each one-unit increase in Product Innovation is associated with an estimated 0.696-unit increase in Purchase Intention. The standardized coefficient (β = 0.628) indicates a positive relationship between Product Innovation and Purchase Intention with a relatively substantial standardized effect. The significance value (p < 0.001) provides evidence that the coefficient of Product Innovation differs significantly from zero. Therefore, the results support H1, which states that Product Innovation has a positive effect on Purchase Intention toward new coffee products. The coefficient results are also consistent with the model summary in Table 2, where Product Innovation explained 39.400% of the variance in Purchase Intention (R² = 0.394). Thus, the regression results indicate that higher levels of perceived Product Innovation are associated with higher Purchase Intention among the respondents. The visual examination of the regression residuals is presented through Residuals vs. Dependent and Residuals vs. Covariates, which are shown in Figure 3 and Figure 4, respectively.
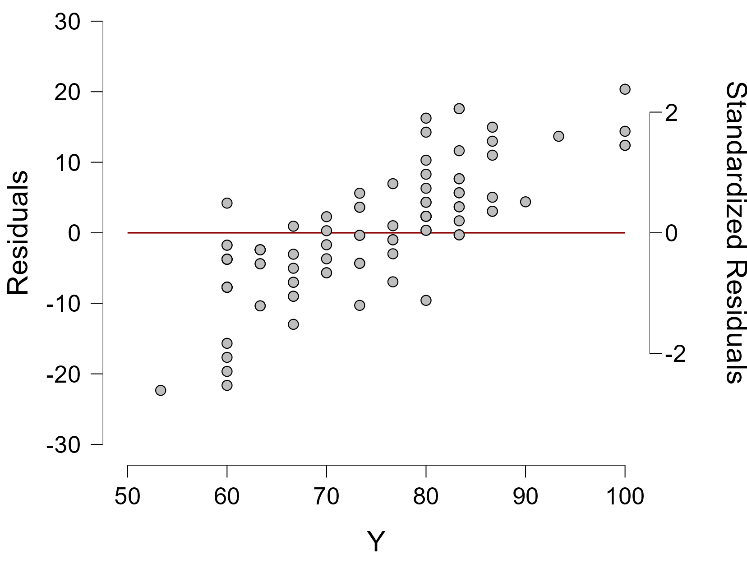
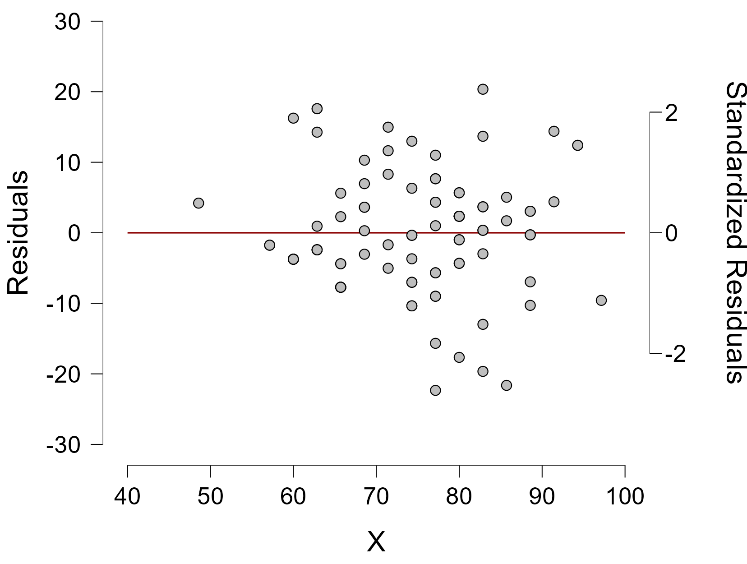
Figure 3 shows that the standardized residuals are distributed around the zero-reference line across the observed Purchase Intention scores. The residuals include both positive and negative values, although several negative residuals appear at lower values of Purchase Intention. Figure 4 shows a similar distribution of standardized residuals across the Product Innovation scores. The residuals are generally scattered around the zero line without a clear systematic pattern or pronounced funnel shape. These visual patterns indicate that the residuals do not show an obvious severe heteroscedasticity pattern, although the dispersion is somewhat wider at higher Product Innovation scores. Overall, Figures 3 and 4 provide visual support for the adequacy of the linear regression model and its residual structure.
Gender Differences in Purchase Intention
At this stage, the second hypothesis is tested to determine whether Purchase Intention differs by gender among university students in Mataram City. An independent-samples t-test is employed to compare the mean Purchase Intention scores between male and female respondents. This analysis aims to identify differences in the mean scores and variability of Purchase Intention across the two gender groups. The descriptive statistics for each group are presented in Table 5.
| Group | N | Mean | SD | SE | Coefficient of variation | Mean Rank | Sum Rank | |
|---|---|---|---|---|---|---|---|---|
| Y | Female | 48 | 72.36 | 10.20 | 1.472 | 0.1409 | 45.26 | 2173 |
| Male | 49 | 75.31 | 11.63 | 1.661 | 0.1544 | 52.66 | 2581 |
Table 5 show that female respondents (n = 48) obtained a mean Purchase Intention score of 72.360, with a standard deviation of 10.200 and a standard error of 1.472. Male respondents (n = 49) obtained a higher mean score of 75.310, with a standard deviation of 11.630 and a standard error of 1.661. The coefficient of variation was 0.141 for female respondents and 0.154 for male respondents, indicating slightly greater relative variability in Purchase Intention among male respondents. The mean rank was 45.260 for females and 52.660 for males, while the corresponding sum of ranks was 2,173.000 and 2,581.000, respectively. These descriptive results indicate that male respondents reported a higher average Purchase Intention than female respondents, although the statistical significance of this observed difference must be determined through the independent-samples test (Table 6).
| Test | Statistic | df | p | Effect Size | SE Effect Size | |
|---|---|---|---|---|---|---|
| Y | Student | -1.325 | 95.00 | .188 | -0.2691 | 0.2049 |
| Welch | -1.327 | 93.87 | .188 | -0.2693 | 0.2049 | |
| Mann-Whitney | 996.5 | .193 | 0.1526 | 0.1173 | ||
| Note. For the Student t-test and Welch t-test, effect size is given by Cohen's d. For the Mann-Whitney test, effect size is given by the rank biserial correlation. |
Table 6 presents the student’s t-test produced a statistic of −1.325 with 95.000 degrees of freedom and a p-value of 0.188. The Welch’s t-test produced a similar result, with a statistic of −1.327, 93.870 degrees of freedom, and a p-value of 0.188. Both tests indicate that the difference in Purchase Intention between the two gender groups was not statistically significant because the p-value exceeded 0.050. The consistent results from the Student’s and Welch’s tests indicate that the conclusion is not substantially affected by the assumption concerning equality of variances. The effect size results provide additional information about the magnitude of the observed difference. The Cohen’s d was −0.269 for the Student’s t-test and −0.269 for the Welch’s t-test, with a standard error of 0.205. The Mann–Whitney test also produced a non-significant result (U = 996.500, p = 0.193), with a rank-biserial correlation of 0.153 and a standard error of 0.117. These results consistently indicate that the observed difference in Purchase Intention between female and male respondents was not statistically significant. Therefore, the findings do not provide sufficient evidence to support H2, which proposed a significant difference in Purchase Intention between male and female university students.
Moderating Effect of Gend
At this stage, the third hypothesis is tested to determine whether Gender moderates the relationship between Product Innovation and Purchase Intention among university students in Mataram City. A moderated regression analysis is conducted by examining the interaction between Product Innovation and Gender. The analysis includes Product Innovation, Gender, and the Product Innovation × Gender interaction term to determine whether the relationship between Product Innovation and Purchase Intention varies across gender groups. The regression coefficients and significance of each predictor, particularly the interaction term, are presented in Table 7.
| Model | Unstandardized | Standard Error | Standardizedᵃ | t | p | |
| M₀ | (Intercept) | 73.85 | 1.115 | 66.21 | < .001 | |
| M₁ | (Intercept) | 21.01 | 6.65 | 3.16 | 0.002 | |
| X | 0.692 | 0.088 | 0.624 | 7.858 | < .001 | |
| Gender (Male) | 2.54 | 1.736 | 1.463 | 0.147 | ||
| M₂ | (Intercept) | 30.25 | 10.09 | 2.998 | 0.003 | |
| X | 0.567 | 0.135 | 0.512 | 4.205 | < .001 | |
| Gender (Male) | -13.54 | 13.35 | -1.015 | 0.313 | ||
| X ✻ Gender (Male) | 0.216 | 0.1777 | 1.215 | 0.227 | ||
| ᵃ Standardized coefficients can only be computed for continuous predictors. |
Table 7 presents the Product Innovation had a positive and statistically significant coefficient (B = 0.692, SE = 0.088, β = 0.624, t = 7.858, p < 0.001). Gender (Male) had a coefficient of B = 2.540 with SE = 1.736, t = 1.463, and p = 0.147, indicating that the main effect of Gender was not statistically significant. These results show that Product Innovation remained a significant predictor of Purchase Intention when Gender was included in the model. The M₁ equation can be expressed as follows Equation (2):
Model M₂ incorporates the interaction between Product Innovation and Gender to test the moderating effect. The resulting equation is expressed as follows Equation 3:
The intercept of 30.250 represents the estimated Purchase Intention when Product Innovation is zero for the reference gender group. The Product Innovation coefficient of 0.567 indicates that a one-unit increase in Product Innovation is associated with a 0.567-unit increase in Purchase Intention for the reference gender group. The Gender coefficient of −13.540 represents the difference in the estimated intercept between the Male group and the reference gender group when Product Innovation equals zero. However, this coefficient was not statistically significant (p = 0.313). The interaction coefficient of 0.216 represents the difference in the Product Innovation slope between the Male group and the reference gender group. Thus, the estimated slope for the Male group is 0.567 + 0.216 = 0.783, whereas the slope for the reference group is 0.567. The interaction term Product Innovation × Gender produced B = 0.216, SE = 0.178, t = 1.215, and p = 0.227. Because the interaction p-value is greater than 0.050, the difference between the Product Innovation slopes across gender groups is not statistically significant. Therefore, the results do not provide sufficient evidence that Gender moderates the relationship between Product Innovation and Purchase Intention. Although the estimated slope for the Male group (0.783) is higher than that for the reference group (0.567), this difference is not statistically significant. Thus, H3 is not supported, indicating that the positive relationship between Product Innovation and Purchase Intention does not differ significantly according to Gender in this sample.
The regression analysis showed that Product Innovation had a positive and significant effect on Purchase Intention (B = 0.692, p < 0.001). This finding is supported by previous research. (Wulandari & Setiyarini, 2025) found that product innovation had a positive and significant effect on purchase intention for Good Day ready-to-drink coffee products among university students. Similarly, (Riandi & Istimaroh, 2024) reported a positive and significant effect of product innovation on purchase intention among consumers of Kopi Kenangan. The consistency of these findings can be explained by the role of innovation in providing new product attributes, flavor variations, modifications, and product characteristics that increase consumer interest. In the present study, respondents also reported relatively high scores for interest in trying innovative coffee products, which is consistent with the significant positive relationship between Product Innovation and Purchase Intention. Therefore, the present finding is consistent with recent evidence from coffee and ready-to-drink beverage contexts.
The independent-samples test indicated that Purchase Intention did not differ significantly by gender (t = −1.325, p = 0.188). This finding is supported by (Tan et al., 2022), who found no significant difference in purchase intention toward organic food between male and female consumers. A similar pattern was reported by (Tengli & Srinivasan, 2022), who found that the relationships between several consumer-related factors and purchase intention were generally similar for male and female consumers of natural cosmetics, with no significant gender differences in purchase intention and its antecedents. These findings suggest that gender does not necessarily produce different levels of purchase intention when consumers evaluate products based on common functional, experiential, or product-related considerations. The similarity in the present study may also reflect the relatively balanced gender composition of the sample, with 48 female and 49 male respondents, and the common consumption context of new coffee products among university students. Therefore, the present result is consistent with recent evidence indicating that gender differences in purchase intention are not necessarily statistically significant across consumer product categories.
The moderated regression analysis showed that the Product Innovation × Gender interaction was positive but not statistically significant (B = 0.216, p = 0.227). Thus, the present study does not provide sufficient evidence that Gender moderates the relationship between Product Innovation and Purchase Intention. This result is consistent with (Suhartanto et al., 2022), who found that gender did not moderate the relationships between the determinants of attitude and behavioral intention toward plant-based food among young Indonesian consumers. However, the finding differs from(Dangelico et al., 2024), who found that gender moderated the relationship between perceived quality and purchase intention for some sustainable beer solutions. The difference may be related to the specific predictor and product context examined in each study. The present study focuses on Product Innovation and new coffee products, whereas Dangelico et al. examined perceived quality and sustainable beer. Therefore, gender may moderate some specific consumer–product relationships but not necessarily the relationship between Product Innovation and Purchase Intention. The non-significant interaction in the present study indicates that the positive association between Product Innovation and Purchase Intention is relatively similar across male and female respondents.
4. Conclusion
The findings show that Product Innovation has a positive and significant relationship with Purchase Intention, with R = 0.628, R² = 0.394, and p < 0.001. Although Purchase Intention did not differ significantly by gender (p = 0.188), the descriptive results show that male respondents had a higher mean Purchase Intention (75.310) than female respondents (72.360). However, this mean difference was not statistically significant and therefore does not provide sufficient evidence of a gender-based difference in the population. In addition, the Product Innovation × Gender interaction was not significant (p = 0.227), indicating that the positive relationship between Product Innovation and Purchase Intention did not differ significantly between male and female respondents. These findings imply that product innovation, particularly product uniqueness, flavor variety, and consumers’ interest in trying new products, may be more relevant to Purchase Intention than gender-based differentiation. Future research should examine consumer innovativeness, perceived product quality, and social influence to provide a more comprehensive explanation of Purchase Intention. Further studies should also investigate digital consumer engagement, consumption experience, and emerging coffee consumption trends to better understand consumer responses to innovative coffee products.
References
- Afif, F., & Fithriya, D. N. L. (2024). Trends in manual brew coffee consumption in Indonesia: Preferences, perceptions, and consumer health. Gastronomy and Culinary Art, 3(2), 95–106. DOI ↗ Google Scholar ↗
- Candra, S., Pandean, E. T., Harisson, J., & Sutanto, S. (2022). The impact of sensory experience on the buying behavior of coffee shop visitors in Indonesia. Journal of International Food & Agribusiness Marketing, 34(2), 214–234. DOI ↗ Google Scholar ↗
- Dangelico, R. M., Fraccascia, L., & Strazzullo, S. (2024). Determinants of the intention to purchase sustainable beer : Do gender and type of sustainable solution matter? Business Strategy and the Environment, 33(7), 6748–6772. DOI ↗ Google Scholar ↗
- Gusti, S., & Khatimah, H. (2026). The effect of product innovation and product discounts on consumer purchase intention on the TikTok Shop platform. Majapahit Journal of Islamic Finance and Management, 6(2), 1906–1917. DOI ↗ Google Scholar ↗
- Hafizza, N. H., Darnetti, & Afrizal, R. (2026). Consumer perceptions of the influence of brand image, store atmosphere, promotions and product innovation on coffee purchasing decisions. Jurnal Ekonomi Dan Bisnis, 5(1), 11–22. DOI ↗ Google Scholar ↗
- Herqutanto, Rosemiarti, T., Dewi, D. K., Soemarko, D. S., & Syam, A. F. (2024). Coffee consumption and alertness: A study among office workers in Jakarta. Frontiers in Nutrition, 11, 1425707. DOI ↗ Google Scholar ↗
- Kijek, T., Angowski, M., & Skrzypek, A. (2020). Millennials use of social media in product innovation purchasing processes. Journal of Computer Information Systems, 60(1), 9–17. DOI ↗ Google Scholar ↗
- Kim, H. (2019). An analysis in preference of coffee consumption by gender and age. Culinary Science & Hospitality Research, 25(9), 129–134. DOI ↗ Google Scholar ↗
- Rayi, G., & Aras, M. (2021). How product innovation and motivation drive purchase decision as consumer buying behavior. Journal of Distribution Science, 19(1), 49–60. DOI ↗ Google Scholar ↗
- Riandi, V., & I. (2024). The effect of product innovation on purchase decision through purchase intention as an intervening variable at Cafe Kopi Kenangan in Samarinda. Research in Management of Technology and Business, 5(2), 969–975. DOI ↗ Google Scholar ↗
- Riandi, V., & Istimaroh. (2024). The Effect of Product Innovation on Purchase Decision Through Purchase Intention as an Intervening Variable at Cafe Kopi Kenangan in Samarinda. Research In Management of Technology and Rmtb, 5(2), 969–975. Article DOI ↗ Google Scholar ↗
- Shim, J., Moon, J., Song, M., & Lee, W. S. (2021). Antecedents of purchase intention at Starbucks in the context of Covid-19 pandemic. Sustainability, 13(4), 1758. DOI ↗ Google Scholar ↗
- Spence, C., & Carvalho, F. M. (2020). The coffee drinking experience: Product extrinsic (atmospheric) influences on taste and choice. Food Quality and Preference, 80, 103802. DOI ↗ Google Scholar ↗
- Suhartanto, D., Kartikasari, A., Arsawan, I. W. E., Suhaeni, T., & Anggraeni, T. (2022). Driving youngsters to be green: The case of plant-based food consumption in Indonesia. Journal of Cleaner Production, 380(2), 1–15. DOI ↗ Google Scholar ↗
- Syahputra, S., Pradana, M., Zulfikar, A., Oktaviani, L., & Utami, F. N. (2021). Theory of planned behaviour of coffee purchase intention among young consumers in Indonesia. Review of International Geographical Education Online, 11(8). DOI ↗ Google Scholar ↗
- Tan, B. C., Pang, S. M., & Lau, T. C. (2022). Marketing Organic Food from Millennials ’ Perspective : A Multi-Theoretical Approach. Foods, 11(18), 1–19. DOI ↗ Google Scholar ↗
- Tengli, A., & Srinivasan, S. H. (2022). An Exploratory Study to Identify the Gender-Based Purchase Behavior of Consumers of Natural Cosmetics. Cosmetics, 9(5), 1–15. DOI ↗ Google Scholar ↗
- Ut-Tha, V., Lee, P.-P., & Chung, R. H. (2021). Purchase intention of certified coffee: Evidence from Thailand. The Journal of Asian Finance, Economics and Business, 8(8), 583–592. DOI ↗ Google Scholar ↗
- van der Merwe, K., & Maree, T. (2016). The behavioural intentions of specialty coffee consumers in South Africa. International Journal of Consumer Studies, 40(4), 501–508. DOI ↗ Google Scholar ↗
- Wang, M.-J. S., Opoku, E. K., & Tham, A. (2024). Exploring Gen-Z consumers’ preference for specialty coffee in the socio-cultural context of Taiwan. Young Consumers, 25(3), 368–382. DOI ↗ Google Scholar ↗
- Wibowo, S. F., Najib, M., Sumarwan, U., & Asnawi, Y. H. (2022). Rational and moral considerations in organic coffee purchase intention: Evidence from Indonesia. Economies, 10(12), 308. DOI ↗ Google Scholar ↗
- Wulandari, S. I., & Setiyarini, T. (2025). Pengaruh Inovasi Produk dan Content Marketing Terhadap Minat Beli Produk Kopi Siap Minum Good Day. J-CEKI : Jurnal Cendekia Ilmiah, 5(1), 2000–2015. DOI ↗ Google Scholar ↗
- Zainuddin, Z., & Shujahat, M. (2022). Understanding students’ activities in Wi-Fi coffee shops in Aceh: A survey and narrative interview report. Englisia: Journal of Language, Education, and Humanities, 10(1), 217–231. DOI ↗ Google Scholar ↗