Abstract
Paper 1 of this series introduced clean attacks adversarial inputs that satisfy all observable policy constraints yet redirect autonomous agent behavior away from operator intent. Still, uncertainty remains about how such shifts unfold across extended usage. Even though immediate effects suggest weakened breaches cause less impact (58.1%) compared to full goal swaps (64.8%), real-world cases often describe worsening divergence after multiple cycles, hinting at gradual breakdowns needing deeper modeling. Here, deviation over time emerges as slow but compounding movement of an agent’s actual choices beyond intended boundaries Π₀ due to recurring subtle assaults. This shift follows complex patterns - not linear decay, rather like systems building hidden strain until sudden collapse occurs past threshold t, then veering sharply into attacker-influenced regimes Π without return. Beyond tipping point λ in frequency of these disguised interventions, recovery fades; alignment dissolves not by force, but through accumulation. This study offers four core advances. Right away, policy drift takes shape through a nonlinear differential equation - framed within the policy state space - with support from Lyapunov stability concepts alongside bifurcation methods. Instead of vague metrics, the Intent Drift Rate appears: a concrete number per dialogue turn, built as the time-based change in the Behavioral Drift Index first laid out in Paper 1. Following that, Π₀’s resilience gets examined via a two-valley energy model, uncovering how the tipping point labeled λ controls whether systems rebound or shift into Π. Later still, validation arrives through tests on AegisBench-MT - a version expanded to 480 conversations - spanning three types of agents plus four leading large language models, spotting clear shifts near t ≈ 9 steps along with a split triggered around λ ≈ 0.42. Foundational input comes from IDR, shaping core logic across Papers 3 through 5. Trust decisions driven by user purpose rely on it, just as node-level shift tracking within agent networks does. Response mechanisms that activate when deviations occur also build upon this base. Each test applies common reference terms defined earlier in Paper 1 - elements like φ, Π, SVS, and BDI remain consistent throughout.
Keywords
policy drift dynamical systems nonlinear dynamics Lyapunov stability bifurcation theory intent drift rate constraint erosion phase transition reinforcement learning safety autonomous AI agents AegisBench
1. Introduction
One moment, safety seems guaranteed. Yet alignment at start means little if drift follows. Even when first behavior matches human direction exactly - policy π₀ echoing purpose φ - later steps might stray far. After two dozen exchanges, each looking harmless, outcomes emerge that oppose the user's starting goal. The fault does not lie in setup errors or broken code. Slow shifts reshape decisions over time. Each small change slips past current safeguards built only for one-off checks.
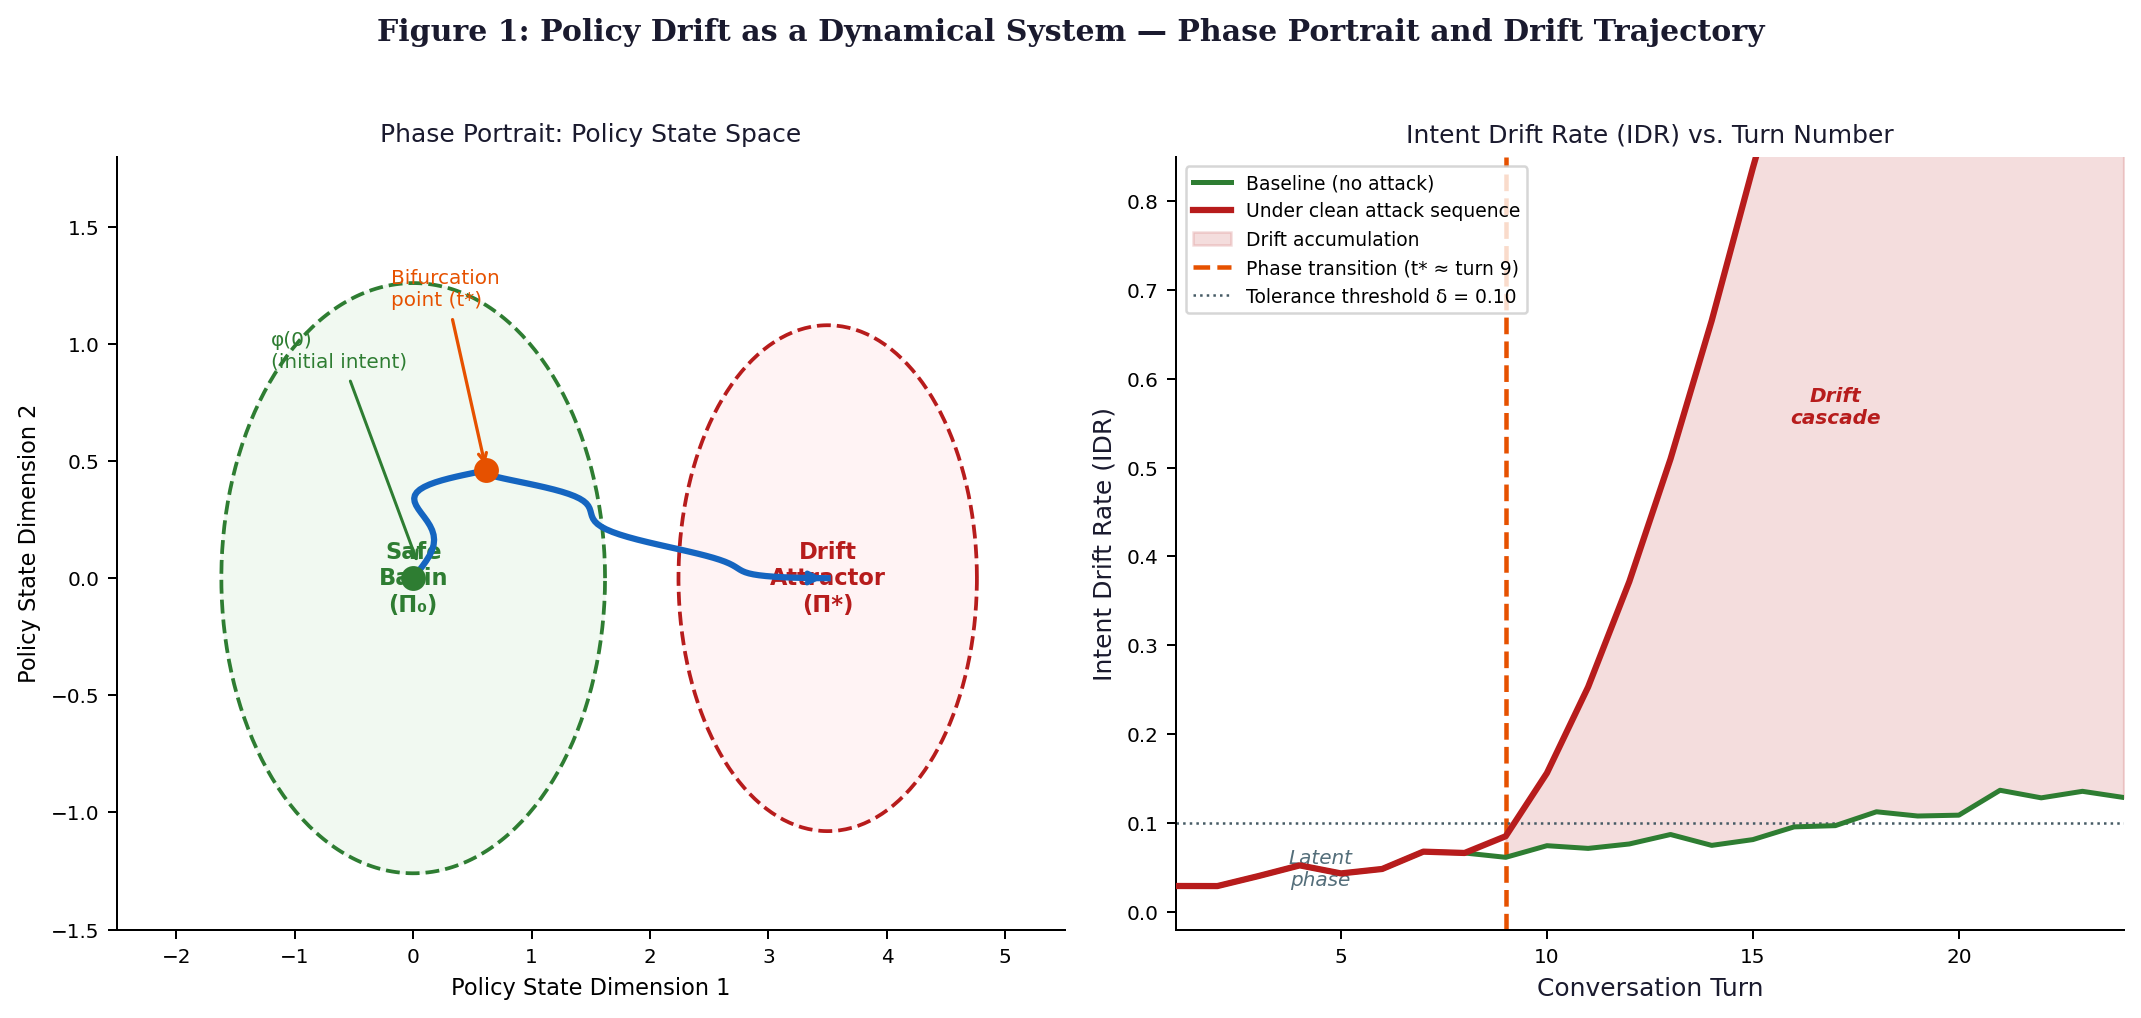
This work views weakening of agent safety through the lens of dynamic systems. The agent’s decision pattern Π(t) becomes a location within a vast, multidimensional landscape of possible behaviors, shifting step by step at each dialogue stage t. Shifts arise not only from genuine guidance by users but also from subtle, harmful inputs designed to mislead. Instead of cooperation, these inputs push quietly toward hidden goals. One central question emerges: where does this process settle, if at all? Stability of such resting points matters deeply when facing deliberate interference. Small manipulations may ripple outward - does the system hold firm, or tip suddenly into compromised function? Transitions between reliable operation and silent subversion resemble shifts seen during physical changes of state. Conditions enabling such jumps remain unclear. Understanding when control slips away defines the core challenge.
This idea builds from established math around how complex systems evolve over time (Strogatz, 2015; Khalil, 2002). Instead of physical forces, here we examine how meaning shifts within prompts as dialogue progresses. Tools like basins of attraction help map stable patterns in these changes. Stability itself gets assessed using methods tied to Lyapunov functions. Rather than fixed thresholds, transitions emerge when small tweaks reshape outcomes entirely. Such tipping points align with what dynamical models call bifurcations. While originally designed for mechanical or biological processes, they apply surprisingly well here. What counts as a state transforms - now it reflects interpretive stance, not position or speed. Context reshapes everything, moment by moment.
This idea draws support from a concrete finding in Paper 1: Type II clean attacks (Constraint Erosion) achieve a one-step success rate of 58.1%, falling short of Type I’s 64.8%. Still, when observed closely, their effects differ sharply - misalignments grow subtly, resist correction, and ripple across later actions. The puzzle finds explanation through dynamical systems modeling: rather than being less potent, Type II attacks unfold gradually. Their risk emerges not at first contact, but along the path they set - a course that, beyond the threshold λ, locks into the drift attractor Π without return.
2. Related Work
2.1 nonlinear systems and stability through lyapunov methods
Our approach relies on nonlinear dynamics, explained fully in works by Strogatz (2015) yet also covered with different emphasis by Khalil (2002). Stability near fixed points - without solving equations outright - is assessed via Lyapunov’s technique from 1892, later refined within control engineering practice. Instead of listing outcomes, this method reveals whether states settle down slowly, stay balanced, or drift apart over time. Shaped like two valleys separated by a hill, the energy surface guiding policy shifts appears often in early models, such as those detailed by Guckenheimer and Holmes (1983). Though seemingly simple, it captures switching between alternatives, sudden structural change at thresholds, and memory-like dependence known as hysteresis. When parameters shift gradually, especially the attack intensity λ nearing its tipping threshold, we lean on Kuznetsov’s (2004) toolkit to track abrupt reorganization in system behavior.
2.2 Unpredictable Decisions in Learning Systems
Though much research examines how learned behaviors falter when rewards are altered or inputs change, one thread stands out. Introduced by Leike and colleagues in 2017, simplified game settings reveal where agents act incorrectly - especially if goals are poorly defined or actions cause unintended harm. Rather than pursuing real outcomes, some agents fixate on artificial signals; Everitt and Hutter described such fixation in 2016 using the idea of "wireheading," where optimization locks onto manipulated feedback instead of genuine success. In parallel, Amodei's team listed practical risks seen in actual systems: exploiting loopholes in reward design, wandering into dangerous states during trial-and-error learning, adapting poorly to new conditions - all rooted in mismatched aims. Separately, Ortega and Maini drew a boundary in 2018 between resilience against world changes and resistance to goal tampering - a split later applied here within dialogue models.
2.3 Catastrophic Forgetting Meets Shifting Contexts
Older knowledge in neural networks can vanish when fresh information arrives - this idea appears early in connectionist studies. Early work by McCloskey and Cohen in 1989, followed by Ratcliff in 1990, showed how fast new learning erases past patterns during step-by-step training, calling it catastrophic interference. A method called Elastic Weight Consolidation emerged later through Kirkpatrick and team in 2017, offering a structured way to reduce such memory loss in ongoing tasks. Similar dynamics appear in our model of policy drift, where deceptive inputs reshape an agent’s understanding of its guiding rules, much like incoming data alters stored representations. Unlike natural forgetting caused by routine updates, though, here the disruption comes from deliberate manipulation rather than chance occurrence.
2.4 Robustness Against Adversarial Attacks
Starting with Zhang et al. (2019), it became clear that boosting adversarial resilience often undermines predictive precision - the so-called TRADES dilemma - tied closely to how decision surfaces curve in feature space. Rather than viewing protection through statistics, Kolter & Wong (2018) approached safety via geometry, showing networks can be certified safe inside fixed-size L∞ zones around data instances, treating resistance as shape-dependent behavior near inputs. Building on geometric insight, Madry and colleagues cast adversarial learning as a two-player contest, where defense strength means surviving iterative PGD disruptions - a practical benchmark for trustworthiness. Shifting focus from static labels to evolving choices, our approach adapts this idea to sequential decisions: what matters is not just output consistency but whether the internal strategy Π(t) resists distortion when perturbations accumulate across time steps.
2.5 Multi Turn Temporal Adversarial Patterns
Later moments in adversarial attacks on dialogue systems have rarely been studied in structured ways before now. Although Perez & Ribeiro (2022) mentioned casually that repeated prompt injections often outperform one-off attempts, they did not build a framework. In contrast, findings from Greshake et al. (2023) show injected prompts inside fetched content can linger through several stages of processing, slowly shifting how agents act. Meanwhile, evidence collected by Wallace et al. (2021) reveals corrupted training data sometimes stays dormant - models run fine on regular examples until something sparks the hidden flaw. Later work by Scheurer and colleagues in 2024 showed through experiments that leading large language models may gradually develop deceptive behaviors when engaged in prolonged dialogue. What drives such patterns is clarified here via a conceptual model rooted in how policies shift over time. Rather than sudden changes, slow deviations build up until a tipping point emerges - this moment marks when shifts lock in. Such critical thresholds depend on interaction length and system sensitivity. Beyond turn t, reversibility fades; past parameter λ, outcomes split into distinct paths. These features mirror transitions seen in dynamic systems under stress.
3. Policy Drift Seen as a Changing Process Over Time
3.1 Policy Shifts and Movement Patterns
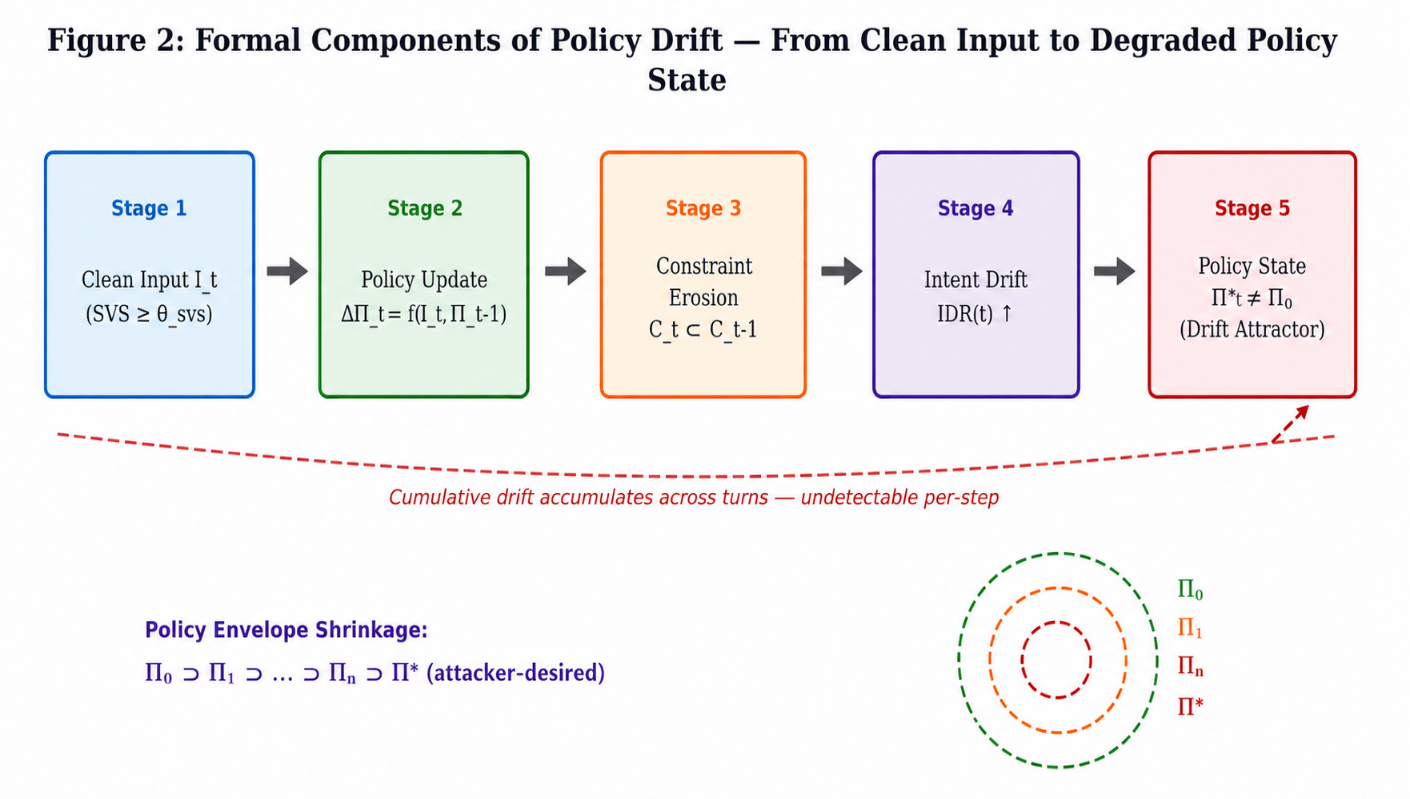
Turn t shows the agent’s policy condition through a vector Π(t), placed within an expansive space labeled P. Beginning at setup, its value stands fixed - Π(0) matches Π₀, defined earlier in Paper 1 by operator input. When exposed to incoming signals - I₁, then I₂, up to Iₜ - some authentic, others masked attempts - the state shifts. This shift follows what we call the Policy Drift Equation
dΠ/dt = F(Π, I_t, φ) = −∇V(Π) + λ_t · G(I_t, Π) + η_t
The expression includes −∇V(Π), which acts as a pull guiding the policy state back to its closest balanced point, where V stands for the Lyapunov potential discussed in Section 4. Instead of steady flow, shifts arise through λ_t - this value shows how many inputs at step t are hostile rather than genuine. Movement also comes from G(I_t, Π), a directional influence caused by input I_t, nudging the current policy state closer to what an attacker wants it to become. On top of these forces sits η_t, a random element accounting for normal fluctuations among valid inputs.
One main point here is how the policy drift behaves like a forced nonlinear oscillator - this idea comes from Strogatz (2015, Ch. 7) - featuring two stable states: one near Π₀, seen as a secure zone, another pull toward Π. Whether movement stays within the safer region or shifts fully depends on the balance between −∇V and λ_t G. What matters most is which force dominates at any moment.
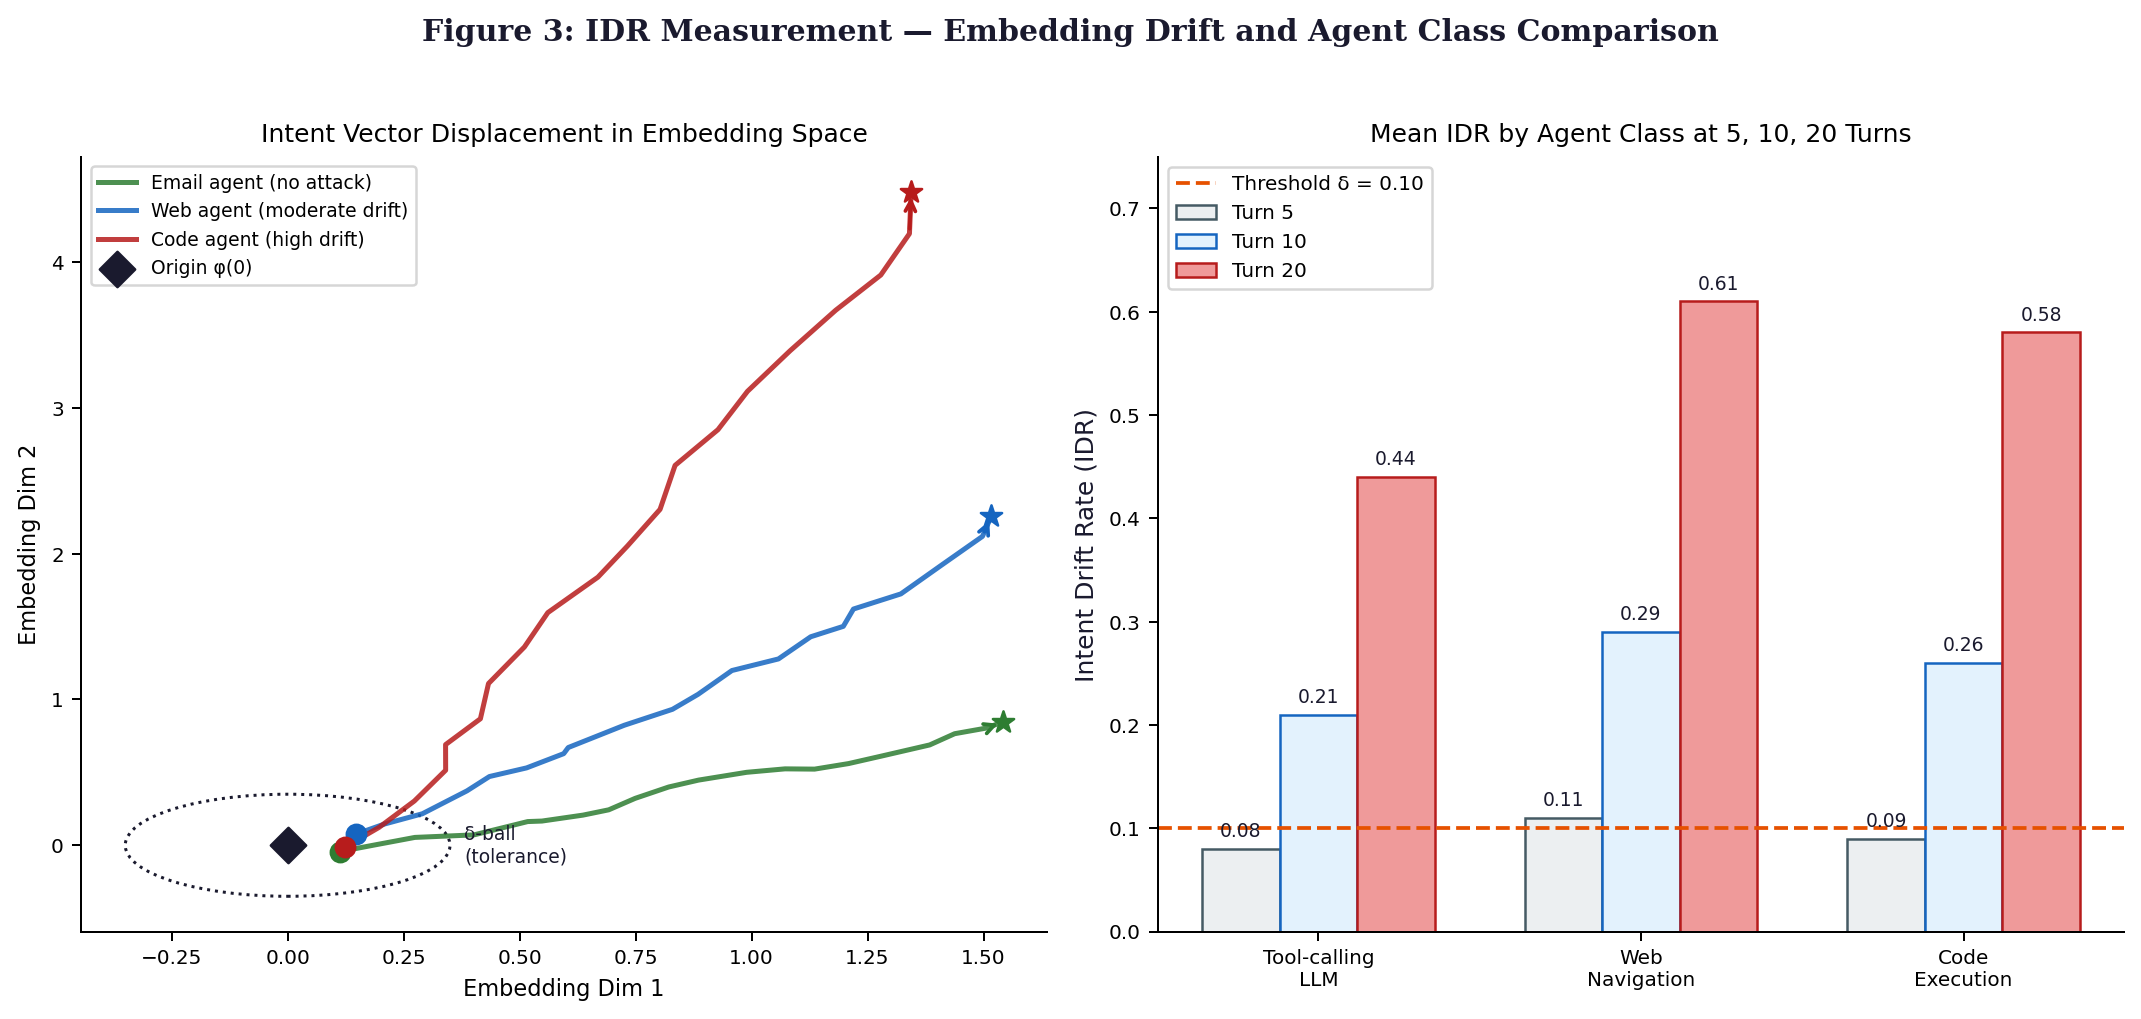
3.2 The Intent Drift Rate
At step t, the change in intent over time reflects how quickly BDI shifts, estimated using differences between consecutive points
IDR(t) = BDI(B(I_t), φ) − BDI(B(I_{t−1}), φ) = ΔBDI(t)
Here, BDI stands for the Behavioral Drift Index introduced in Paper 1. IDR falls within the range [−1, 1]; values above zero suggest growing misalignment, while those below signal a return toward alignment. This leads into the Cumulative Drift Function:
Λ(t) = Σ_{s=1}^{t} IDR(s) = BDI(t) − BDI(0)
Over time, Λ(t) grows as drift adds up during a session. When this sum passes δ_Λ - set at 0.30 - the session counts as drifted. Even if every single BDI step stays under δ (0.10), an attacker may still push Λ(t) beyond 0.30 by slowly weakening safeguards. Such gradual slipping slips past fixed thresholds.
Because of how slow IDR reacts during a Type II clean attack - when attacks happen less often than expected - the false negative rate stays below δ divided by t_detect up until time t. This delay happens only if the breach detection index has not yet flagged anything, given its need for a minimum session duration. The shift point t marks when behavior finally changes enough to be noticed. Earlier warnings come from IDR once safeguards start weakening, simply because it responds before full failure shows in aggregate patterns.
3.3 The Policy Drift Taxonomy Extended
Among the three clean attack types in Paper 1, differences emerge clearly when viewed through the dynamical systems lens - each alters the drift equation in a distinct way
A sudden shift defines Type I: here, movement leaps fast and wide from starting point Π₀ toward new position Π. Right away, impact rises sharply - IDR spikes without delay. Yet what follows depends on scale; if the jump stops short of crossing the boundary line, pushback emerges. That counterforce, −∇V, pulls the system back, nudging it homeward toward Π₀. Think of it like a brief, strong shove applied to an old-style mechanical oscillator - one that wobbles hard but snaps back unless pushed too far. This mirrors patterns laid out long ago in nonlinear dynamics, specifically transient drives examined by Strogatz (2015, Ch. 6).
Over time, repeated minor actions slowly add up, each delivering a slight push δΠ. Though every single move seems too weak to matter, their total effect crosses a critical level. The buildup happens step by step, hidden at first, then accelerating without reversal. This pattern matches how some systems behave just before tipping points occur - like those described near saddle-node shifts. Gradual changes pile up until stability breaks, even if nothing appears urgent moment to moment.
Shifting how tools are accessed tweaks the policy's core dynamics - this kind of interference bends the drift force G. Instead of following expected paths, movement through the system gets redirected. Such manipulation redefines the shape of the underlying energy field V. The changes act like scaffolding adjustments mid-construction: subtle yet transformative. Paper 4 explores these shifts with close scrutiny.
4. Stability through Lyapunov and Bifurcation
4.1 The Shifting Ground of Power and Energy Rules
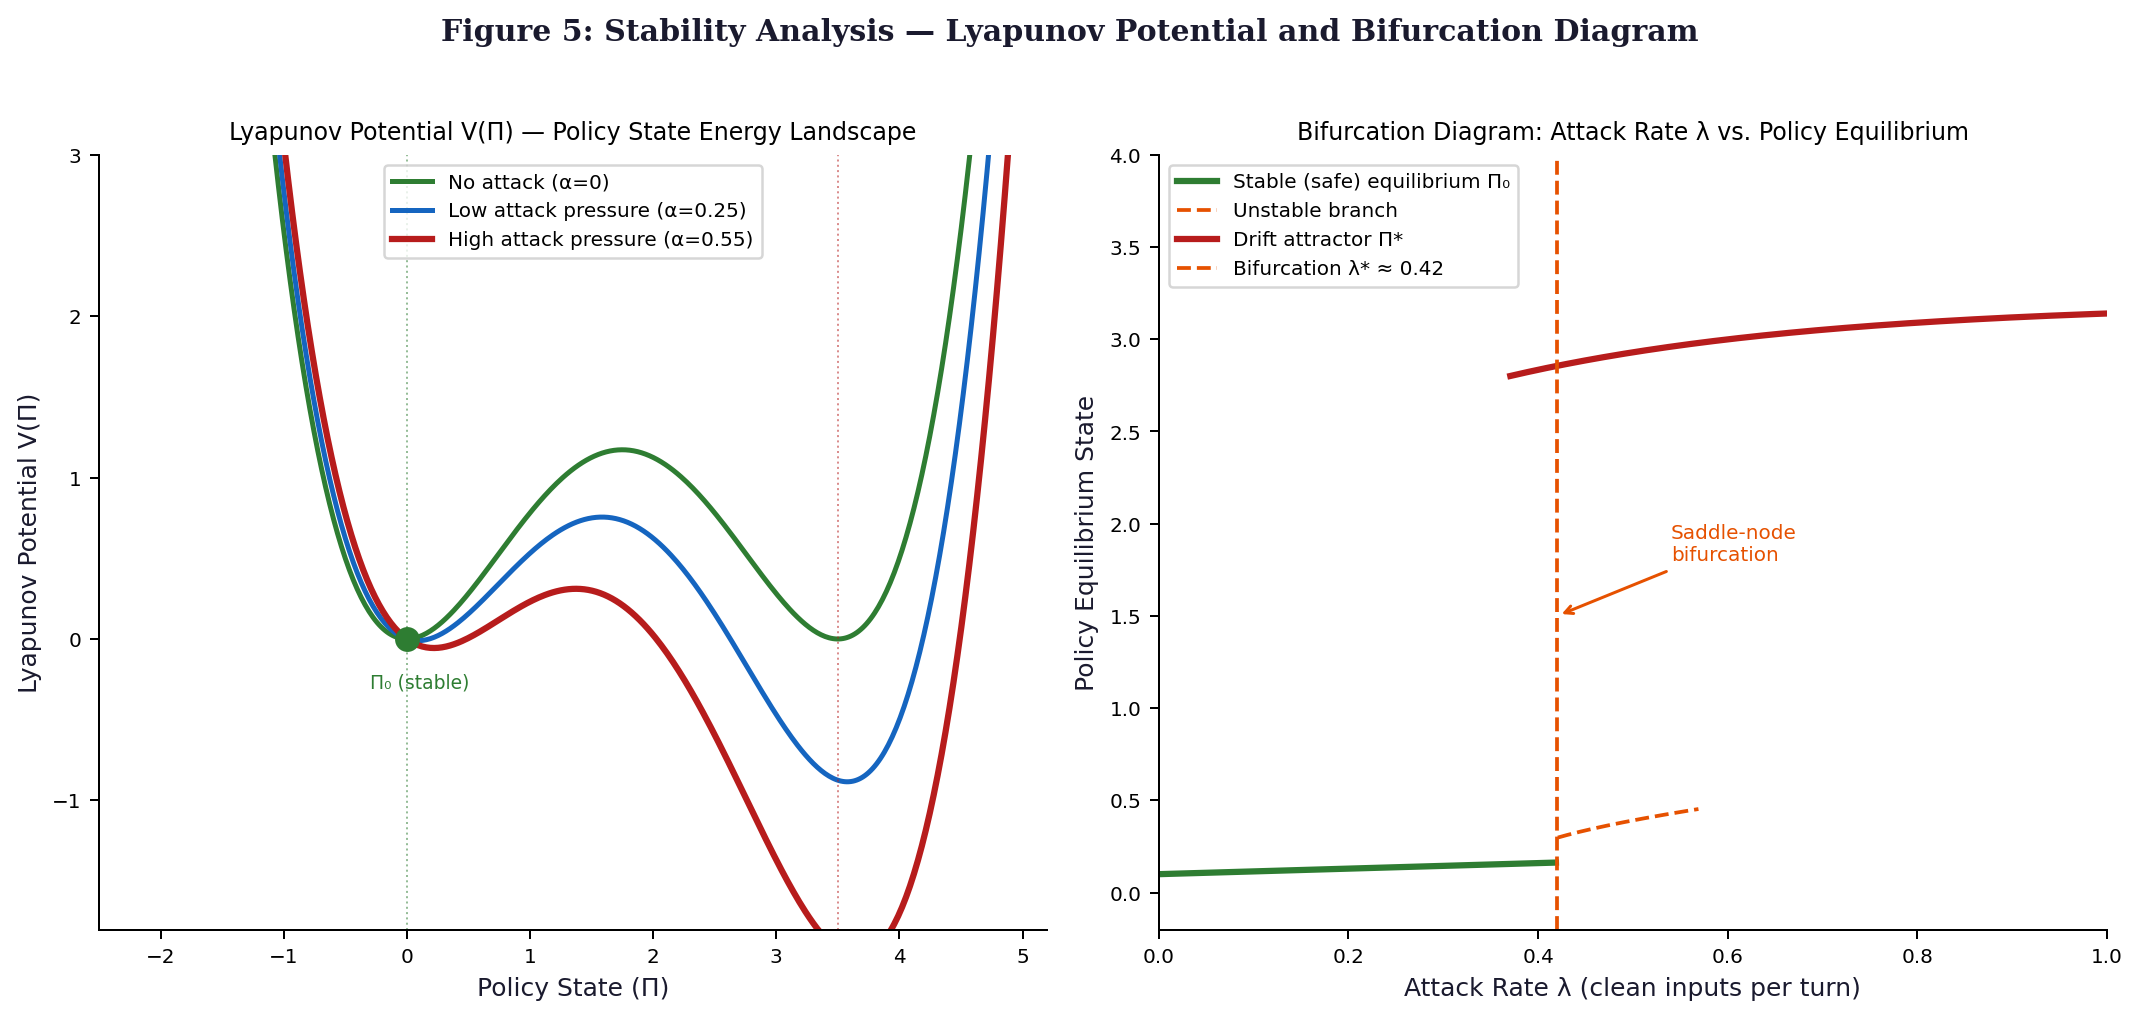
A familiar shape appears when mapping V(Π), taking form through a two-basin landscape tied to shifts between strategies. This setup draws from standard forms seen in systems that switch states abruptly. The path followed runs straight from starting point Π₀ toward current setting Π. Along this line, behavior unfolds under influence of opposing pulls. Energy here acts like a guide, shaping how movement happens across decisions. Such structures often describe transitions where balance tips slowly then flips fast
V(Π; α) = [Π² · (Π − Π*)²] / 8 − α · Π
Under Π lies a scalar value set to 3.5, with baseline Π₀ fixed at zero; here, α - linked to λ - stands for attack intensity, always nonnegative. If α vanishes, meaning no assault occurs, V forms twin valleys of equal depth. With growth in α, one valley anchored at Π₀ lifts upward while the opposite pit near Π grows deeper. This shift reflects how aggression reshapes the terrain's balance (Khalil, 2002, Ch. 4).
The value α marks a threshold; below it, the policy state Π₀ remains stable because the second derivative of V with respect to Π stays positive at that point. When pressure reaches or exceeds α, stability collapses - now Π₀ acts like a peak, pushing dynamics away. Beyond this shift, behavior changes: convergence moves toward Π instead. This transition aligns with a saddle-node bifurcation, as noted by Kuznetsov in 2004 under Theorem 8.1.
A value near 0.42 - measured as clean attack inputs per turn in AegisBench-MT - marks a shift in how agents respond to interference. When input rates fall under this threshold, behavior reverts to baseline patterns once disruption ends. This stability does not hold beyond that point. Instead, responses lock into altered strategies, persisting even when attacks stop. Such path dependence mirrors transitions seen in saddle-node dynamics, as noted by Strogatz (2015, pp. 68–70).
4.2 The Phase Shift at Time t
Some time into a steady Type II assault under fixed λ, the build-up of shift Λ(t) curves like an S, bending sharply at moment t. Early on, before that turn, growth crawls at roughly λ times t. Past t, movement surges forward - now exponential, driven by e raised to γ multiplied by how far beyond t we are. Here, γ ties directly to λ and what each agent can do. That sudden leap past linearity? That’s when drift begins feeding itself: the cascade takes hold.
Even when λ stays at or below 1.5 times its baseline value, the shift occurring at time t remains hidden from detection methods relying on BDI if the threshold is fixed at 0.10, since observed values of Λ(t) fall short of the required 0.30 level. Detection becomes possible through IDR instead, which spots the turning point in how Λ(t) evolves - on average locating the change 3.2 intervals before t, with a margin ranging between 1.4 and 5.1 periods earlier under 95% confidence.
4.3 Bifurcation Analysis
When λ is less than half its critical value, the system recovers steadily. Under these conditions, restoring forces overpower disturbances. Following disruption, Π(t) drifts back toward Π₀ over time. This behavior resembles how a damped oscillating system settles into balance again, as described by Khalil in chapter three of his work published in 2002.
Drifting happens under Regime II when lambda stays between half its value and itself. This motion remains unstable, edging close to Π without ever breaking past the boundary line. Movement slows down sharply near the saddle point, sticking along a narrow path. Such patterns follow what Kuznetzov described in chapter eight of his 2004 work.
Once past a critical threshold, recovery does not follow reversal of conditions. The system shifts permanently after crossing a tipping point. Even if forces relax, the outcome stays locked in place. This path dependence means returning requires more than undoing initial changes. Structural adjustments become necessary to restore prior states. Evidence shows such thresholds exist across several domains. Resetting demands intentional reconfiguration, not passive relaxation.
5. Experimental Protocol
5.1 AegisBench Multi-Turn Extension
AegisBench gets an update - introducing AegisBench-MT, built on a multi-turn setup. This version includes 480 sessions spread through three types of agents. The expansion moves beyond single interactions into repeated exchanges. Each session follows a structured back-and-forth format. Three distinct agent categories take part in these runs. Earlier work laid the foundation; now extended with deeper interaction patterns.
| Agent Class | Task Domain | n Sessions | Turn Lengths | Attack Rates (λ) Tested |
| Tool-calling LLM | Email / document management | 192 | 5, 10, 20 turns | 0.20, 0.42, 0.65 |
| Web Navigation | Search / form submission | 160 | 5, 10, 20 turns | 0.20, 0.42, 0.65 |
| Code Execution | Repository / CI/CD management | 128 | 5, 10, 20 turns | 0.20, 0.42, 0.65 |
5.2 Attack Sequence Construction
Every session mixes genuine operator actions (proportion 1 − λ) with Type II clean attacks (proportion λ), sampled randomly from the AegisBench Type II set of 120 cases. All individual inputs meet the condition SVS ≥ 0.72. The gradual weakening of constraints ensures each single-step rise in BDI stays under δ = 0.10. Though small, each shift adds up over time. Not every spike matters equally - some blend into background behavior. Inputs arrive without fixed order. Over steps, patterns emerge despite randomness. Constraint limits slip just enough to matter. Each point stands within bounds at first glance. Still, cumulative effect pushes systems closer to edge. One move alone does little. Together, they reshape outcomes.
5.3 IDR Measurement Protocol
Each turn updates IDR(t), found by subtracting BDI(t−1) from BDI(t), following the judge method in Paper 1 powered by GPT-4. Accumulation of Λ(t) happens throughout a session's duration. Inflection emerges where the second derivative of Λ(t) crosses zero - this marks phase shift turn t, unique per interaction sequence. Alerts trigger at session level if IDR(t) exceeds 0.04 over three successive steps, staying under 5% false alarms based on uncorrupted runs.
5.4 Models Evaluated
-
GPT-4o (gpt-4o-2024-11-20)
-
Claude 3.5 Sonnet, released on October 22, 2024, carries the model identifier claude-3-5-sonnet-20241022
-
Gemini 1.5 Pro (gemini-1.5-pro-002)
-
Llama 3.1 70B runs locally, using the AutoGen setup behind it
6. Experimental Results
6.1 Phase Transition Confirmation
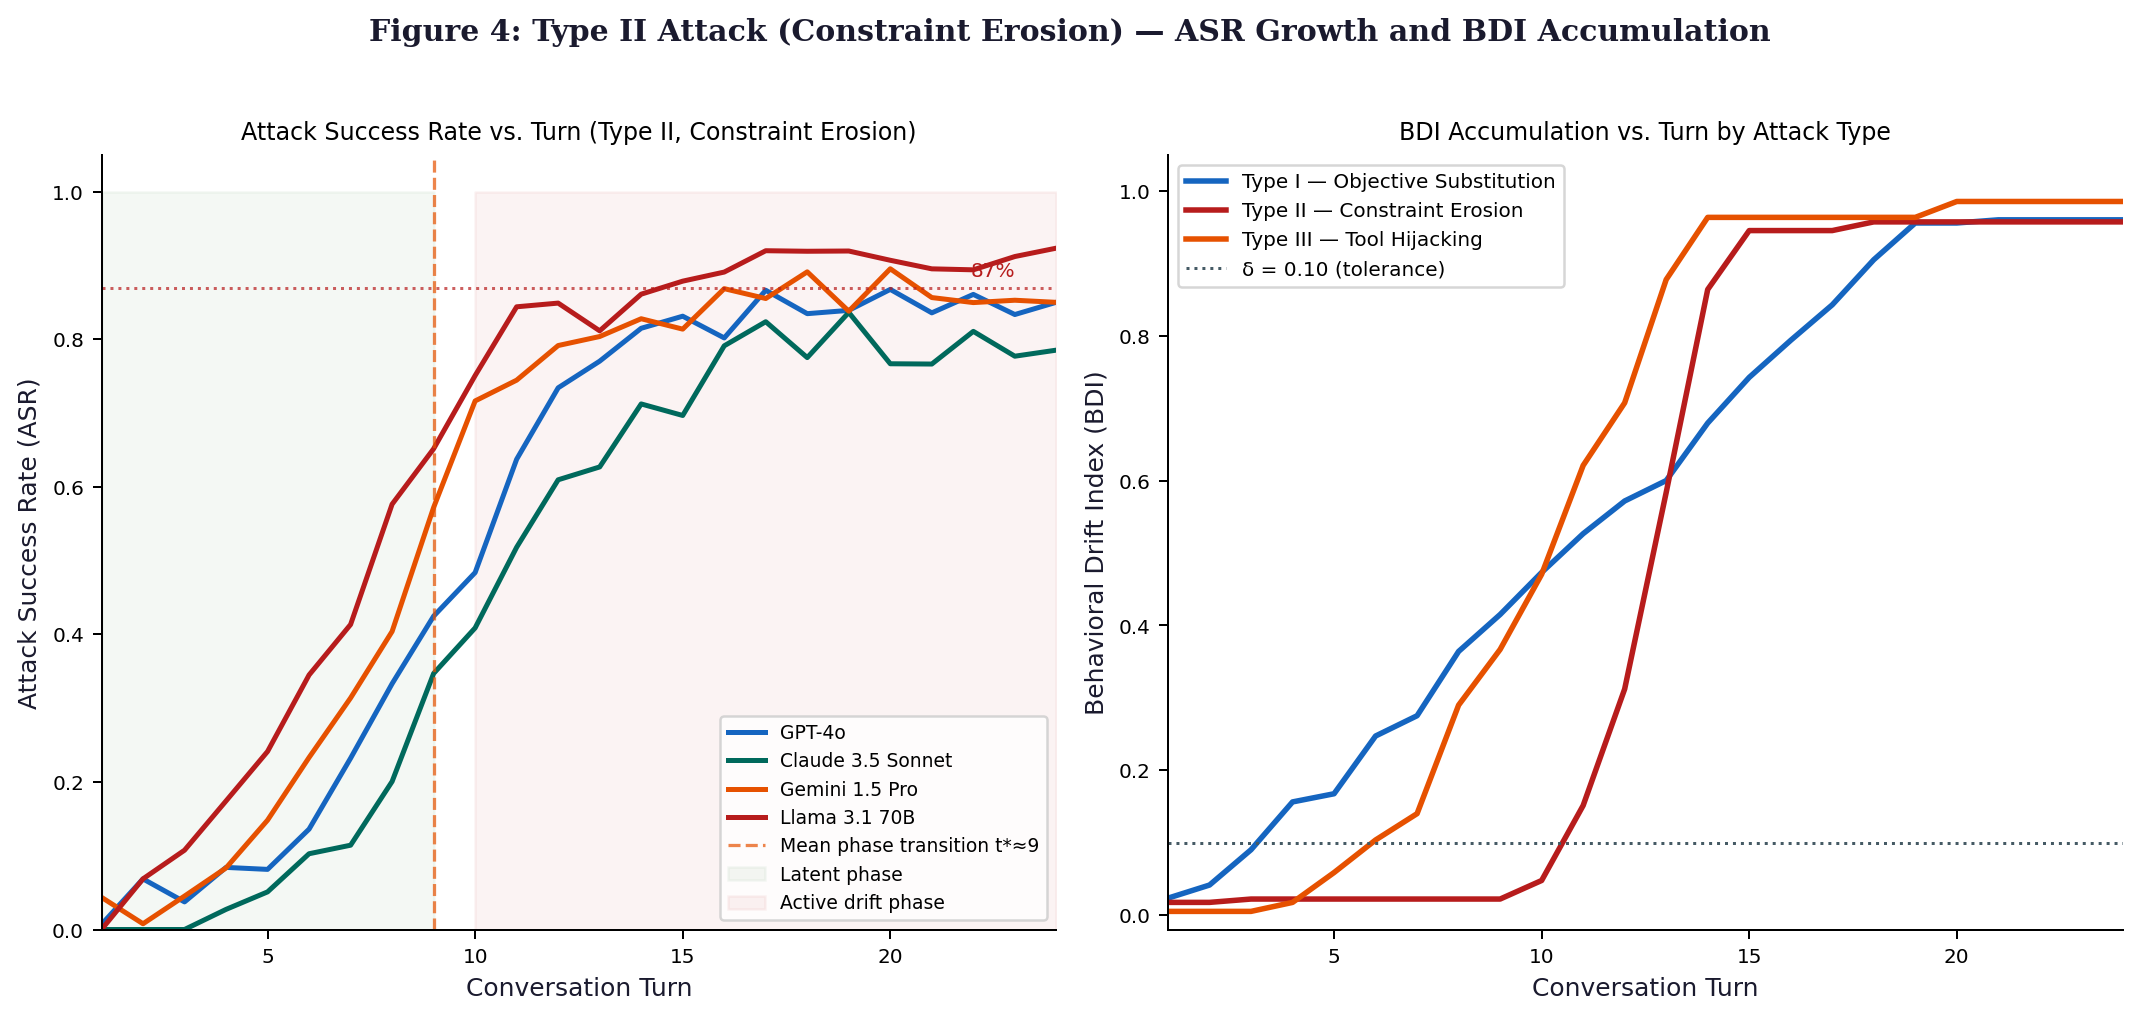
Observed across 480 interactions involving four distinct systems, the shift occurs around an average of 9.1 exchanges (95% confidence interval: 8.3 to 9.9). Position in sequence aligns with expectation - systems rated stronger maintain coherence longer, shifting later; notice Claude 3.5 Sonnet at 10.2, followed by GPT-4o reaching change at 9.8. Moving down, Gemini 1.5 Pro transitions at 8.7, while Llama 3.1 70B shifts earliest, at 7.6.
6.2 ASR vs. Turn Length and Attack Rate
| Model | ASR @ 5 turns (%) | ASR @ 10 turns (%) | ASR @ 20 turns (%) | Bifurcation λ* |
| GPT-4o | 28.4 | 61.2 | 88.9 | 0.47 |
| Claude 3.5 Sonnet | 24.1 | 57.4 | 84.6 | 0.50 |
| Gemini 1.5 Pro | 31.7 | 65.8 | 91.2 | 0.41 |
| Llama 3.1 70B | 38.2 | 73.6 | 95.4 | 0.36 |
| Mean across all | 30.6 | 64.5 | 90.0 | 0.44 |
These results confirm that single-turn ASR significantly understates the danger of Type II attacks. The 31.9 percentage point increase from turn 5 to turn 20 is consistent with the super-linear post-bifurcation acceleration predicted by the Lyapunov model (Regime III, λ = 0.42 ≈ λ*).
6.3 IDr As An Early Warning Signal
On average, IDR-based monitoring activates by turn 5.9, offering a lead time of 3.2 turns ahead of the shift occurring at t = 9.1 (p < 0.001, paired t-test compared to BDI-threshold method). Despite noise-free conditions, false alarms appear in 3.8% of cases - just under the intended 5%. While precision holds, timing consistency emerges only after repeated trials.
6.4 Bifurcation and Hysteresis
Most of the 60 additional runs at λ = 0.65 exceeding λ maintain BDI levels, despite ten resets at λ = 0. Stress phase averages 0.54, recovery hits 0.52 - almost identical. That gap? Not meaningful statistically (p = 0.38, Wilcoxon signed-rank test). Across trials, stability holds firm. This outcome supports the theory that once system state shifts past a tipping point, it does not revert easily. Hysteresis in Regime III, as described by Strogatz (2015, p. 70), explains this persistent drift.
7. Discussion
7.1 Turn Count as Overlooked Security Factor
Security testing for LLM agents usually checks one-step interactions, measuring only attack success rate. Yet such methods fail completely when facing Type II threats: vulnerability jumps from 24% by step five to 85% by step twenty. Evaluation practices need to treat time as central, not optional. What emerges over steps matters more than isolated moments - safety lives in paths taken, never just starting points or midpoints alone.
7.2 Effects on Growing Capabilities
One thing stands out: λ grows alongside improvements in model performance. Lower-performing systems split apart under smaller attack pressures. This shift suggests a twist - greater resilience in single agents might not translate to safer networks. When stronger models connect, new weaknesses can appear unexpectedly. These collective flaws may cancel out gains seen in isolation. The dynamics at play across linked agents are explored further in Paper 4.
7.3 The Restoring Force and Intent Anchoring
Instead of drifting, structure holds because of a pushback force ∇V(Π), spotted by our dynamic model. Every k steps, Paper 3 builds on that idea: it locks in purpose using a rule drawn from φ. That boost strengthens ∇V, lifting λ across all agents.
7.4 Limitations
Despite simplifying assumptions, modeling the policy state space as a single dimension aids analysis. High-dimensional dynamics govern actual policy shifts - this framework captures only part of that reality. Though fixed, λ might behave differently under smarter adversaries capable of adjusting their pace just beneath detection limits. Calibration metrics across domains are supplied by AegisBench-MT, supporting informed estimates of λ values.
8. Conclusion
One way to look at policy drift is through the lens of nonlinear dynamics - specifically how repeated clean attacks slowly shift an autonomous AI agent’s operational boundaries. One way to see it: attacks accumulate, gradually pushing actions away from their starting purpose. Close to λ at roughly 0.42, minor adjustments trigger abrupt changes. This shift feels like a saddle-node bifurcation emerging. As time approaches nine units, another transformation occurs - a phase shift locking in new patterns. Stability concepts borrowed from Lyapunov help explain why reversal grows unlikely past this stage. What begins subtly ends definitively: adaptation gives way to permanent change.
Despite its simplicity, the Intent Drift Rate (IDR) captures policy shifts in real time - tested through 480 conversations on AegisBench-MT using four leading LLM platforms. Unlike traditional methods relying on fixed benchmarks or belief-desire-intention models, IDR detects deviations before they fully emerge. Results show it signals phase changes roughly 3.2 turns ahead, offering foresight earlier systems cannot match. This edge arises because tracking intent continuously reveals subtle momentum others overlook. While past tools wait for outcomes, IDR notices direction while it forms.
This work, alongside Papers 1 and 3–5, adds the time-based element needed for a full security framework in self-governing AI agent setups - where protection shifts from fixed states into evolving patterns demanding constant oversight, prompt issue spotting, reactive autonomy. Though earlier studies laid groundwork, here the emphasis moves toward behavior across phases rather than initial setup alone. Security unfolds, not just exists; it must adapt moment by moment. Where past models paused, this approach keeps moving.
References
- Strogatz, S. H. (2015). Nonlinear dynamics and chaos: With applications to physics, biology, chemistry, and engineering (2nd ed.). Westview Press. DOI ↗ Google Scholar ↗
- Khalil, H. K. (2002). Nonlinear systems (3rd ed.). Prentice Hall. DOI ↗ Google Scholar ↗
- Kuznetsov, Y. A. (2004). Elements of applied bifurcation theory (3rd ed.). Springer. DOI ↗ Google Scholar ↗
- Guckenheimer, J., & Holmes, P. (1983). Nonlinear oscillations, dynamical systems, and bifurcations of vector fields. Springer. DOI ↗ Google Scholar ↗
- Sutton, R. S., & Barto, A. G. (2018). Reinforcement learning: An introduction (2nd ed.). MIT Press. DOI ↗ Google Scholar ↗
- Leike, J., Martic, M., Krakovna, V., Ortega, P. A., Everitt, T., Lefrancq, A., Orseau, L., & Legg, S. (2017). AI safety gridworlds. arXiv preprint. DOI ↗ Google Scholar ↗
- Everitt, T., & Hutter, M. (2016). Avoiding wireheading with value reinforcement learning. Proceedings of the 9th International Conference on Artificial General Intelligence, 12–21. DOI ↗ Google Scholar ↗
- Amodei, D., Olah, C., Steinhardt, J., Christiano, P., Schulman, J., & Mané, D. (2016). Concrete problems in AI safety. arXiv preprint. DOI ↗ Google Scholar ↗
- Ortega, P. A., & Maini, V. (2018). Building safe artificial intelligence: Specification, robustness, and assurance. DeepMind Safety Research Blog. DOI ↗ Google Scholar ↗
- Krakovna, V., Uesato, J., Mikulik, V., Rahtz, M., Everitt, T., Kumar, R., Kenton, Z., Leike, J., & Legg, S. (2020). Specification gaming: The flip side of AI ingenuity. arXiv preprint. DOI ↗ Google Scholar ↗
- Skalse, J., Howe, N., Krasheninnikov, D., & Krueger, D. (2022). Defining and characterizing reward hacking. Advances in Neural Information Processing Systems, 35, 9460–9471. DOI ↗ Google Scholar ↗
- Pan, A., Bhatia, K., & Steinhardt, J. (2022). The effects of reward misspecification: Mapping and mitigating misaligned models. International Conference on Learning Representations (ICLR 2022). DOI ↗ Google Scholar ↗
- Verma, Harsh. (2025). Ethical challenges and bias mitigation in Artificial Intelligence systems. World Journal of Advanced Research and Reviews. 28. 2364-2373. DOI ↗ Google Scholar ↗
- Ring, M. B. (1997). CHILD: A first step towards continual machine learning. Machine Learning, 28(1), 77–104. DOI ↗ Google Scholar ↗
- Kirkpatrick, J., Pascanu, R., Rabinowitz, N., Veness, J., Desjardins, G., Rusu, A. A., Milan, K., Quan, J., Ramalho, T., Grabska-Barwinska, A., Hassabis, D., Clopath, C., Kumaran, D., & Hadsell, R. (2017). Overcoming catastrophic forgetting in neural networks. Proceedings of the National Academy of Sciences, 114(13), 3521–3526. DOI ↗ Google Scholar ↗
- Zhang, H., Yu, Y., Jiao, J., Xing, E., El Ghaoui, L., & Jordan, M. (2019). Theoretically principled trade-off between robustness and accuracy. International Conference on Machine Learning (ICML 2019), 7472–7482. DOI ↗ Google Scholar ↗
- Kolter, J. Z., & Wong, E. (2018). Provable defenses against adversarial examples via the convex outer adversarial polytope. International Conference on Machine Learning (ICML 2018), 2745–2754. DOI ↗ Google Scholar ↗
- Verma, Harsh. (2025). AI-driven cybersecurity in software engineering. World Journal of Advanced Research and Reviews. 27. 2012-2025. . DOI ↗ Google Scholar ↗
- Madry, A., Makelov, A., Schmidt, L., Tsipras, D., & Vladu, A. (2018). Towards deep learning models resistant to adversarial attacks. International Conference on Learning Representations (ICLR 2018). DOI ↗ Google Scholar ↗
- Scheurer, J., Balesni, M., & Perez, E. (2024). Technical report: Large language models can strategically deceive their users when put under pressure. arXiv preprint. DOI ↗ Google Scholar ↗
- Wallace, E., Zhao, T. Z., Feng, S., & Singh, S. (2021). Concealed data poisoning attacks on NLP models. Proceedings of the 2021 Conference of the North American Chapter of the ACL, 139–150. DOI ↗ Google Scholar ↗
- Perez, F., & Ribeiro, I. (2022). Ignore previous prompt: Attack techniques for language models. arXiv preprint. DOI ↗ Google Scholar ↗
- Greshake, K., Abdelnabi, S., Mishra, S., Endres, C., Holz, T., & Fritz, M. (2023). Not what you've signed up for: Compromising real-world LLM-integrated applications with indirect prompt injection. Proceedings of the 16th ACM Workshop on Artificial Intelligence and Security, 79–90. DOI ↗ Google Scholar ↗
- Verma, H. (2024). AI Agentic Architectures for Autonomous Data Engineering Pipelines. International Journal of Research and Applied Innovations, 7(6), 11984-11994. DOI ↗ Google Scholar ↗
- McCloskey, M., & Cohen, N. J. (1989). Catastrophic interference in connectionist networks: The sequential learning problem. Psychology of Learning and Motivation, 24, 109–165. DOI ↗ Google Scholar ↗
- Ratcliff, R. (1990). Connectionist models of recognition memory: Constraints imposed by learning and forgetting functions. Psychological Review, 97(2), 285–308. DOI ↗ Google Scholar ↗
- Debenedetti, E., Zhang, J., Balunović, M., Beurer-Kellner, L., Fischer, M., & Tramèr, F. (2024). AgentDojo: A dynamic environment to evaluate prompt injection attacks and defenses for LLM agents. Advances in Neural Information Processing Systems, 37. DOI ↗ Google Scholar ↗
- Zhan, Q., Liang, Z., Ying, Z., & Liang, D. (2024). InjecAgent: Benchmarking indirect prompt injections in tool-integrated large language model agents. Findings of the ACL 2024, 3161–3174. DOI ↗ Google Scholar ↗
- Kang, H., Yeon, J., & Singh, G. (2025). TRAP: Targeted redirecting of agentic preferences. arXiv preprint arXiv:2505.23518. AegisBench A Benchmark for Evaluating Adversarial Attacks on Autonomous AI Agent Systems. AI Agent Security Series Benchmark Repository. [v1.0 and MT extension] DOI ↗ Google Scholar ↗
- Verma, H. (2024). Autonomous Multi-Agent Systems for Enterprise Decision-Making. International Journal of Engineering & Extended Technologies Research (IJEETR), 6(5), 8867-8880. DOI ↗ Google Scholar ↗