Abstract
With over 1.24 million deaths recorded annually worldwide, road traffic accidents are a serious problem requiring careful attention. The recent increase in traffic accidents along intercity roads in Cameroon raises concerns. On the measures taken by the public authorities. Our the methodological approach consisted of doing surveys, observations, and data collection were conducted using questionnaires over a five-month period from December 2024 to April 2025. Using data processing and analysis tools, we obtained a significant number of accident factors on our intercity routes, the content of which is based onExcessive speed (16.54%) ; drunk driving (16.04%) ; road condition (12.35%) ; mobile phone use while driving (11.36%) ; and vehicle condition (9.14%), together constituting 65.45% of the total percentage. The study of the scores shows that the best alternative is therefore to combine the most appropriate communication-educational and legal measures, with scores of 4.37 and 4.01 respectively.
Keywords
Accident analysis road safety intercity routes.
1. Introduction
Road traffic accidents claim many victims in several countries around the world, with 1.24 million road traffic deaths recorded annually worldwide according to the WHO in 2013 . WHO statistics (2021) show that these accidents result in approximately 1.3 million deaths and over 50 million injuries worldwide each year. This has prompted many countries to take measures aimed at reducing accidents and implementing mechanisms to make roads safer for all types of road users . Thus, road safety traditionally depends on the human-vehicle-environment triangle. It is multifactorial and involves improving each of these three elements, but it is also systemic, meaning that one must keep in mind the numerous interactions between factors related to humans, the environment, and the vehicle . Consequently, in recent years, the context of intercity travel in Cameroon has been marked by an increase in road traffic between the country's different regions, following the country's development and population growth. To this end, the National Institute of Statistics conducts annual thematic analyses to contribute to the national accident statistics, which are verified by the transport authority responsible for road safety and prevention. It also produces comprehensive thematic studies to inform public policy. Available data, collected from police reports, indicate a high rate of road fatalities, which has been steadily increasing since 1999. Between 1992 and 1998, between 732 and 973 deaths were recorded on the roads each year ; this figure rose to 1,372 in 2000 and 1,512 in 2001. In 2001, this corresponded to a rate of 60 deaths per 10,000 registered vehicles, a rate 35 times higher than the rate recorded in the European Community. However, pavement pathologies therefore refer to all the problems that occur in the road surface after a period of use . We distinguish between cracks, deformations, and deterioration of the wearing course . The aim of this work is to identify the factors contributing to road accidents on intercity roads in Cameroon and to conduct a multi-criteria analysis of different response scenarios to Hierarchical Process Analysis (HPA), which will allow for the structuring and prioritization of alternative solutions to the problem of the increase in traffic accidents in order to be able to make a comparison and identify the most appropriate solutions.
2. Materials And Methods
This was a retrospective descriptive study over a 5-months period from December 2024 to April 2025. The study was conducted on roads connecting the Western, Littoral, Southwestern, Northwest, Central, and Eastern regions consisting of examining past data already collected on road accidents occurring between 2013 and 2022 while identifying trends in the data using both secondary and primary data. The Primary data will reveal accident-risk behaviors according to drivers and other road users, the roads most affected by traffic accidents according to drivers and other road users, the types of vehicles most involved on our intercity roads, the times of day with the most accidents according to drivers of rolling stock, responsibility for the deplorable state of roads on intercity roads, as well as the factors contributing to traffic accidents, and secondary data will... the evolution of the disaster in Cameroon from 2013-2022, The evolution of accident rates in Cameroon on intercity roads and finally the evolution of the types of accidents on intercity roads, all over the same period. This approach was structured around two main phases :
-
Collection : via questionnaires designed to collect information on the circumstances of accidents and contributing factors. The latter include the following sections : driver behavior that contributes to the most accidents ; roads most affected by traffic accidents ; the types of vehicles most involved ; the times of day with the most accidents ; and responsibility for the deplorable state of roads on intercity routes.
-
Data processing : Included were motorists, local residents and travellers who agreed to participate in the study and accident data provided by the Ministry of Transport on intercity routes between 2013 and 2022 were also taken into account.
Sampling was carried out using the formula n = z2 . P . (1 – P) / e2 because the total size of the studied population n was greater than 100 (n>100) in five (05) Regions of the country and selected not only for their proximity but also for their high accident rate and traffic density.
With :
-
n = sample size
-
Z = confidence score (1.947)
-
P = estimated proportion of accidents with certain characteristics (0.5)
-
e = margin of error (0.056)
Secondary data on road traffic accidents within the national territory were obtained from the Ministry of Transport, specifically the Road Safety and Prevention Division. Trend analysis was conducted using harmonized data from the Ministry of Transport archives and gendarmerie reports. These trends were analyzed according to the time period, geographical area, type of accident, and the characteristics of the vehicles and drivers involved.
Data entry, processing and analysis were carried out using Excel and Decision Lens software.
In order to propose solutions to the problem of the increase in traffic accidents on our major roads, we studied different scenarios using the AHP (Hierarchical Process Analysis) method, which is a multi-criteria decision-making method that allows us to structure and prioritize the alternatives of a decision problem.in order to be able to make a comparison and identify the most appropriate solutions. It is important to note that it works in three key steps : Problem description, pairwise comparison, and synthesis and prioritization.
-
Problem description:It is broken down into a hierarchy of objectives, criteria, sub-criteria and alternatives (solutions) ;
-
Pairwise comparison:Each element of the hierarchy is compared in pairs with other elements of the same level, according to their importance relative to the element at the higher level, using Saaty's scale which ranges from 1 to 9 :
1 : the two criteria are of equal importance ;
3 : the first criterion is slightly more important than the second ;
5 : the first criterion is more important than the second ;
7 : the first criterion is much more important than the second ;
9 : The first criterion is extremely more important than the second.
The scoring procedure and consistency check were adapted from the AHP method to meet the specific needs of the study .
It unfolded as follows :
-
Determining the objective:The main objective is to choose the most effective road safety measure to implement from among those already in place ;
-
Identification of criteria : The criteria for evaluating road safety measures are : cost of implementation, effectiveness in reducing accidents, ease of implementation and social acceptability ;
-
Identifying alternatives:The alternatives are road safety measures such as technological, legal or regulatory measures and educational or communication measures.
-
Calculation of criterion weights:They are calculated using the geometric mean method.
wi = ∏ j = 1 n aij n (1)
Or :
p = wi ∑ i = 1 n wi (2)
Or :
-
wi =geometric mean of criterion i ;
-
aij =element of the comparison matrix in row i and column j ;
-
n =number of criteria.
-
pi =weight of criterion i ;
Results And Discussion
Results
The study included 300 individuals, with 50 from each region. Among them were 120 drivers (40%), 150 local residents (50%), and 30 travelers (10%). The following figures emerge from this study:
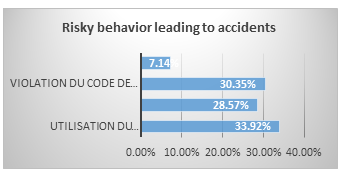
Analysis of Figure 1 reveals that using a mobile phone while driving (33.92%) is the most frequently observed risky behavior among drivers and a major contributing factor to accidents. Traffic violations (30.35%) and driving under the influence of alcohol (28.57%) are also concerning behaviors with a significant impact on road safety. Furthermore, although not wearing seat belts (7.14%) is not mentioned as frequently, it remains an important risk factor that should not be overlooked when analyzing risky behaviors.
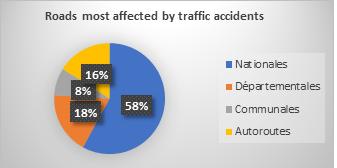
Analysis of Figure 2 According to our survey, the roads most affected by traffic accidents on intercity routes in Cameroon are national roads with a high percentage of 58% of accidents compared to others, this surely due to the density of traffic on these routes.
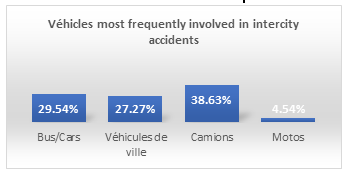
Analysis of Figure 3 shows that the vehicles most involved in accidents on intercity roads are trucks with a percentage of 38.63% followed by buses/coaches with a percentage of 29.54%.
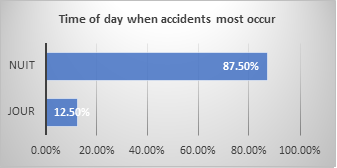
This analysis of Figure 4 reveals that 87.5% of traffic accidents on intercity roads occur more frequently at night than during the day, likely due to poor visibility, fatigue, and failure to comply with traffic laws. These accidents are generally the most serious and deadly.
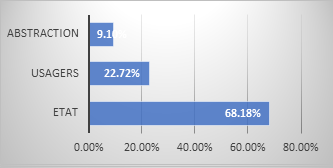
Analysis of Figure 5 reveals that, according to road users and drivers, the State is 68.18% responsible for the deplorable state of roads on intercity routes, while users bear 22.72% of the responsibility. We also note a considerable abstention rate of 9.10%.
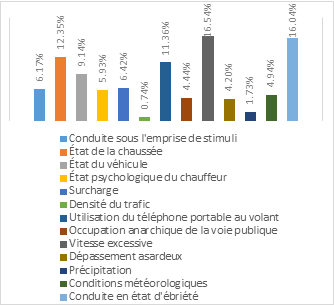
Of the 13 factors identified, a significant number of contributing factors to accidents on our intercity roads are based on excessive speed (16.54%), drunk driving (16.04%), road surface conditions (12.35%), mobile phone use while driving (11.36%), and vehicle condition (9.14%), together constituting 65.45% of the total percentage. This analysis also reveals that excessive speed (16.54%) and drunk driving (16.04%) are the most significant factors, with a combined percentage of 32.58%, representing half of the total percentage of primary factors (65.45%), which aligns with the results of and which also reveal that the main risk factors for road safety in Cameroon are speeding with a rate of 60% and 90% respectively, failure to comply with traffic rules with a rate of 31%, the state of the roads with a rate of 65.5% and driver fatigue with a rate of 65.7%. To these factors, we can add, among others, factors such as the lack of road signs on our roads, insufficient safety measures, violations of the highway code, irregular road maintenance, and non-enforcement of regulations. However, we observe that most of these factors share a common denominator: a road safety culture. All the elements mentioned above (accident factors) are an integral part of this culture and contribute significantly to the occurrence of traffic accidents.
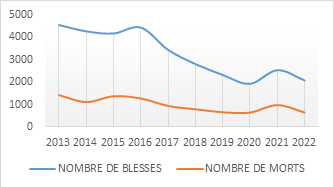
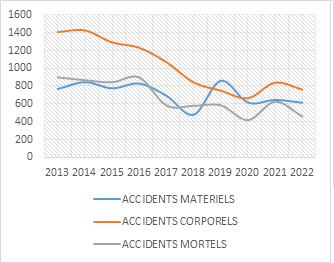
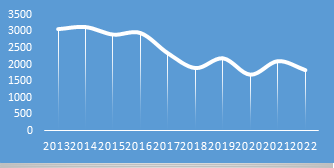
Graphs 7, 8, and 9 respectively illustrate the sawtooth pattern of changes in the number of incidents, accident statistics, and types of road traffic accidents over the same period. Overall, the accident statistics during this period show a downward trend, with the number of accidents on intercity roads decreasing by almost half, despite the fact that the number of deaths and injuries remains considerable. This could be related to the numerous awareness campaigns initiated in recent years on these topics and also to the strengthening of control measures actions taken by public authorities and the effectiveness of certain actions implemented by them, thus reflecting a clear awareness on the part of users. However, it is important to note that these factors were not directly tested in this study. Other factors could also have contributed to this trend. Therefore, the data suggest a correlation between the decrease in the number of accidents and awareness campaigns and the strengthening of control measures, but further research is needed to determine whether these factors are indeed the cause of this trend.
| Years | Wounded | Mortals | Accidents |
| Gendarmerie | Gendarmerie | Gendarmerie | |
| 2016 | 21.80% | 20.82% | 2954 |
| 2017 | 16.90% | 15.34% | 2341 |
| 2018 | 13.78% | 12.91% | 1898 |
| 2019 | 11.38% | 10.67% | 2192 |
| 2020 | 13.55% | 13.86% | 2275 |
| 2021 | 12.43% | 15.90% | 2107 |
| 2022 | 10.17% | 10.58% | 1833 |
| Trends 2016-2022 | -53.33% | -49.64% | -37.94% |
From 2016 to 2022, a considerable decrease of approximately -53.33% in the number of injured was recorded, based on the analysis of the Gendarmerie reports, -49.64% in the number of fatalities and -37.94% in the number of accidents over the same period, according to the same Gendarmerie reports analyzed.
| Objective | |
| Choose the most effective road safety alternative to implement from those that exist. | |
| Identification of criteria | |
| C1:implementation cost | C2:effectiveness in reducing accidents |
| C3:ease of implementation | C4:social acceptability |
| Sub-criteria | |
| C1: Implementation cost | C2: Effectiveness in reducing accidents |
| Initial setup cost | Reduction in the number of accidents |
| Maintenance cost | Reducing the severity of accidents |
| Operating costs | Impacts on the safety of vulnerable users |
| C3: Ease of implementation | C4: Social acceptability |
| Complexity of implementation | Acceptance by road users |
| Lead time | Impact on the quality of life of local residents |
| Need for human and material resources | Compliance with current regulations |
| Alternatives | |
| A1:technologies | A2:legal or legal |
| A3:education or communication |
The goal here is to provide the best solution after a careful analysis of the scenarios. Using the data from the previous table, this cross-matrix comparison of criteria emerges, allowing us to calculate not only the averages but also the weights of the different criteria.
| Criteria | Implementation cost | Effectiveness in reducing accidents | Ease of implementation | Social acceptability |
| Implementation cost | 1 | 1/3 | 1/2 | 1/4 |
| Effectiveness in reducing accidents | 3 | 1 | 2 | 3 |
| Ease of implementation | 2 | 1/2 | 1 | 2 |
| Social acceptability | 4 | 1/3 | 1/2 | 1 |
This comparison matrix shows that :
-
The effectiveness in reducing accidents is 3 times greater than the cost of implementation ;
-
Ease of implementation is twice as important as implementation cost but slightly less important than effectiveness ;
-
Social acceptability is 4 times more important than the cost of implementation.
-
Geometric mean:
w1 = 1 * 1 3 * 1 2 * 1 4 4 = 0 , 435
w2 = 3 * 1 * 2 * 3 4 = 2 , 080
w3 = 2 * 1 2 * 1 * 2 4 = 1 , 189
-
Implementation cost
-
Effectiveness in reducing accidents
-
Ease of implementation
-
Social acceptability
w4 = 4 * 1 3 * 1 2 * 1 4 = 0 , 904
-
Weighting of criteria:
p1 = 0 , 435 0 , 435 + 2 , 080 + 1 , 189 + 0 , 904 = 0 , 09
p2 = 2 , 080 0 , 435 + 2 , 080 + 1 , 189 + 0 , 904 = 0 , 45
p3 = 1 , 189 0 , 435 + 2 , 080 + 1 , 189 + 0 , 904 = 0 , 26
-
Implementation cost
-
Effectiveness in reducing accidents
-
Ease of implementation
-
Social acceptability
p4 = 0 , 904 0 , 435 + 2 , 080 + 1 , 189 + 0 , 904 = 0 , 20
| Criteria | Weight | A1 | A2 | A3 |
| Implementation cost | 0.09 | 4 | 2 | 3 |
| Effectiveness in reducing accidents | 0.45 | 3 | 5 | 4 |
| Ease of setup | 0.26 | 4 | 3 | 5 |
| Social acceptability | 0.20 | 3 | 4 | 5 |
-
Determining the optimal choice:To do this, we will multiply each score by the weight of the criterion for each alternative. Thus, we will have :
A1= 3.35
A2= 4.01
-
A1 = (4*0.09) + (3*0.45) + (4*0.26) + (3*0.20)
-
A2 = (2*0.09) + (5*0.45) + (3*0.26) + (4*0.20)
-
A3 = (3*0.09) + (4*0.45) + (5*0.26) + (5*0.20)
A3 = 4.37
Based on the various overall scores of the alternatives, it appears that the best alternative is A3, but to achieve the desired effect or impact, it will therefore be necessary to combine A2has A3given their score for an optimal solution. Hence, the education/communication and legal/jurisdiction measures are the most appropriate, with scores of 4.37 and 4.01 respectively.
3. Discussion
The main purpose of the work of this study was to conduct a survey of road traffic accidents in Cameroon on intercity roadsin order to understand the trends and characteristics of these accidents and then to identify the contributing factors. Three specific objectives guided our approach, each of which is discussed here in light of the results obtained and the available references. The analysis revealed that the death rate from traffic accidents on intercity roads compared to the overall mortality rate was in freefall until 2019 before gradually rising until 2021 and falling again until 2022. From 2016 to 2022, a considerable decrease of approximately -53.33% was recorded in the number of injured, based on the analysis of Gendarmerie reports, -49.64% in the number of fatalities and -37.94% in the number of accidents over the same period, according to the same Gendarmerie reports. Compared to the situation before 2015, these findings are consistent with those of a study conducted in 2014 by , which revealed that the number of traffic accidents resulting in injuries, as recorded by the gendarmerie (on intercity roads), decreased by 31%. The number of fatal accidents also fell by 44%, according to the gendarmerie. The overall number of accidents recorded also decreased by 17%.
In a second step, we identified accident factors through field surveys of drivers and road users. This participatory approach revealed a diversity of perceptions regarding the causes of accidents. The results, presented as histograms, show that the major causes are : Excessive speed (16.54%) ; drunk driving (16.04%) ; road conditions (12.35%) ; mobile phone use while driving (11.36%) ; and vehicle condition (9.14%) together account for 65.45% of the total percentage. These findings are consistent with those of a study conducted between 2003 and 2007 on the Yaoundé-Douala axis by which revealed that human factors (Such as dangerous overtaking and excessive speed) accounted for approximately two-thirds of the causes of accidents. Risky behaviors such as using a mobile phone while driving, driving without a license, disregarding traffic laws, and the absence of safety equipment (helmet, seatbelt) are particularly highlighted, and those of the study conducted in 2025 along the same lines by which also revealed that the risk factors for road safety in Cameroon are speeding, failure to respect traffic rules, the condition of the roads, and driver fatigue. These observations confirm that road accidents are less a matter of chance than of recurring risky behaviors. In this respect, our study aligns with the findings of the [10], of , which emphasize behavioral prevention as a major lever for reducing accidents.
Finally, we analyzed the different road safety scenarios as optimal solutions and subsequently deduced the best alternative. This analysis therefore concludes that the best solution is education/communication as a measure to combat it with a score of 4.37 followed by the legal solution with a score of 4.01 but to achieve the desired result and obtain a more effective return, it would be appropriate to combine the two educational and legal solutions.
4. Conclusion
Road accidents are an alarming and concerning problem for the Cameroonian authorities, particularly on intercity roads connecting major cities. Faced with this troubling situation, this study proposes an approach consisting of to conduct a survey of road traffic accidents in Cameroon on intercity roadsin order to understand the trends and characteristics of these accidents, while also identifying the contributing factors.and by analyzing the different road safety scenarios as the optimal solution in Cameroon. The most frequently found factors are speed, drunk driving, vehicle condition and mobile phone use while driving, which constitute risky behaviors for road users with respective percentages of 16.54%, 16.04%, 12.35%, 11.36%.
A considerable decrease of approximately 53.33% in the number of injuries was recorded, based on an analysis of Gendarmerie reports. A 49.64% decrease in the number of fatalities and a 37.94% decrease in the number of accidents were also observed during the same period, according to the same Gendarmerie reports. Analysis of the various road safety scenarios for optimal solutions revealed that education/communication as the best approach, with a score of 4.37, is the most effective measure. However, to achieve the desired result and obtain a more efficient outcome, it would be wise to combine educational and legal solutions. In light of these results, it is therefore necessary to review the prevention strategy and intensify efforts on these two measures. Ultimately, this work highlights the different factors behind accidents on different intercity routes even in a context of limited data, but also offers a better alternative adapted to the local context, and which can be easily deployed to strengthen prevention and control in Cameroon.
Conflict Of Interest
The authors declare no conflict of interest.
References
- Aïssaoui. (2009). Pathology of structures: the case of the deterioration of aeronautical pavements in southern Algeria. Mostaganem: In Magister in Civil Engineering, University of Mostaganem. DOI ↗ Google Scholar ↗
- Babo & Batjé. (2025). Road Safety Evaluation Relating to Accident Statistics in Cameroon: Case of National Road No. 3 (Yaoundé/Douala). Douala. DOI ↗ Google Scholar ↗
- Bombah et al. (2023). Human Factors in Traffic Accidents in Yaoundé: A Study of 487 Cases. Health Sciences and Disease, 37. DOI ↗ Google Scholar ↗
- Charbit. (1997). Human factors in traffic accidents: significant potential for prevention efforts. MAIF Foundation. DOI ↗ Google Scholar ↗
- Gilbert. (2009). 5. Defining and obscuring. When road safety eclipses public health. In Claude Gilbert and Emmanuel Henry, How public health problems are constructed. DOI ↗ Google Scholar ↗
- Jane and Justice. (2003). Traffic accidents in Cameroon from 1982 to 2001. DOI ↗ Google Scholar ↗
- Kengne & Morom Wale. (2025). Design of a road traffic accident prediction system based on machine learning: Case of the city of Douala. DOI ↗ Google Scholar ↗
- Lagarde, E. (2007). Road traffic, injury is an escalating burden in Africa and deserves proportionate research efforts. PLoS Med. DOI ↗ Google Scholar ↗
- Lewhe & Ouarda. (2009). Road traffic accidents and identification of risk factors: a prospective study conducted at the forensic medicine department of the Annaba University Hospital on 236 cases. Annaba. DOI ↗ Google Scholar ↗
- WHO. (2018). Global Status Report on Road Safety. DOI ↗ Google Scholar ↗
- Peden et al. (2004). World Report on road traffic injury prevention. World Health Organization. DOI ↗ Google Scholar ↗
- Priti Gautam et al. (2018). Performance evaluation in road safety in Cameroon. Yaoundé: ECA-ONU. DOI ↗ Google Scholar ↗
- Saaty TL (1980). The analytic hierarchy process:Planning, Priority Setting, ResourceAllocation. McGraw-Hill, New York. DOI ↗ Google Scholar ↗
- Sandrone. (2008). Identification and analysis of long-term pathologies of tunnels on Swiss National Roads. Lausanne: In Doctoral thesis no. 4019, Swiss Federal Institute of Technology Lausanne. DOI ↗ Google Scholar ↗