Abstract
The Niger Delta concentrates almost all of Nigeria's onshore and shallow-water hydrocarbon production inside one of the lowest-lying, most rapidly changing deltaic systems in Africa. Recurrent extreme floods — most notably in 2012 and 2022 — have inundated flow stations, gas plants, manifolds, export terminals and pipeline corridors, forcing production deferment, damaging electrical and control assets, and mobilizing legacy hydrocarbon contamination across floodplains and creeks. This paper develops an integrated, reproducible screening assessment of climate-induced flood hazard, exposure and physical vulnerability for petroleum production facilities in the nine Niger Delta states, and translates the results into climate-resilient engineering and disaster-risk-reduction (DRR) requirements. Three open datasets are combined: SRTM15+ topography and bathymetry, NASA POWER (MERRA-2) daily precipitation for 1981–2024 at four delta locations and nine state centroids, and geoBoundaries administrative boundaries. Results show that 14–15% of the land surface of Rivers and Bayelsa States lies below 5 m above mean sea level and 34–38% below 10 m; screening elevations at 11 of 16 major surveyed assets are at or below 10 m, and five are at or below 5 m. Local precipitation trends over 1981–2024 are heterogeneous and mostly statistically non-significant (Theil–Sen slopes between −183 and +145 mm decade⁻¹; Kendall's τ, p > 0.05 at three of four locations), with a significant decline in moderate-rain days at Port Harcourt (τ = −0.220, p = 0.037) and a significant increase in heavy-rain days (≥ 50 mm) at Eket (τ = 0.225, p = 0.041). This heterogeneity is diagnostically important: catastrophic delta flooding is dominated not by local rainfall totals but by compound drivers — upstream Niger–Benue discharge and reservoir releases, tidal and storm-surge backwater, relative sea-level rise amplified by subsidence and sediment starvation, and the degradation of drainage and mangrove buffers. A composite flood vulnerability index (CFVI), built from six normalised topographic, hydro-climatic, coastal and asset-density indicators, ranks Rivers (0.979), Bayelsa (0.939) and Delta (0.625) as the priority states. Lognormal fragility functions adapted from the Natech literature indicate that electrical, instrumentation and control assets — not primary containment — govern early loss of function: at 1 m inundation the conditional damage probability exceeds 0.85 for substations and 0.55 for control rooms, while unanchored low-fill atmospheric tanks reach 0.5 near 1.6 m. The paper proposes a five-tier design flood level (DFL) framework with criticality-based freeboard, buoyancy and scour design checks, Natech-aware emergency shutdown logic, and an adaptation portfolio in which low-cost operational and nature-based measures dominate early benefit–cost rankings. The findings support a shift in Nigerian petroleum engineering practice from static, historically calibrated flood design to adaptive, criticality-differentiated, Natech-integrated resilience planning.
Keywords
climate change adaptation flood risk Natech risk Niger Delta oil and gas infrastructure resilient engineering disaster risk reduction fragility functions
1. Introduction
River deltas host a disproportionate share of the world's population, agricultural land and industrial infrastructure while occupying a small fraction of its surface, and they are simultaneously subsiding, sediment-starved and exposed to rising seas (Syvitski et al., 2009; Tessler et al., 2015). Coastal flood exposure in deltas is growing faster than the global average because relative sea-level rise — the sum of climatic sea-level rise and often much larger anthropogenic subsidence — outpaces natural aggradation (Edmonds et al., 2020; Nicholls et al., 2021). Satellite observations further indicate that the proportion of the world's population exposed to floods increased between 2000 and 2018, with the fastest growth in low- and middle-income countries where exposure and settlement expansion coincide (Tellman et al., 2021). Warming intensifies the hydrological cycle and, in most model ensembles, increases the frequency and magnitude of extreme river flood events, including across West Africa (Alfieri et al., 2017; IPCC, 2023).
The Niger Delta is Africa's largest delta and the industrial core of Nigeria's petroleum economy. Its onshore and swamp terrain carries thousands of kilometres of flowlines and trunk pipelines, hundreds of
flow stations and gas gathering facilities, several major gas processing plants, two of the country's four refineries, and the crude export terminals — Forcados, Escravos, Brass, Bonny and Qua Iboe — through which the great majority of Nigerian crude and liquefied natural gas leaves the country. This infrastructure was largely designed and constructed between the 1960s and the 1990s, using hydrological design assumptions derived from short, stationary historical records and, in many cases, without explicit consideration of compound flood loading, long-term subsidence, or the interaction between flooding and hydrocarbon release.
The consequences of that design legacy have become visible. The 2012 flood, driven by exceptional Niger–Benue discharge combined with reservoir releases, and the 2022 flood, which was even more extensive in the lower delta, inundated production facilities, submerged access roads and helipads, disabled electrical substations and instrument racks, disrupted crude evacuation, and displaced the workforce and host communities on which operations depend. In both events, flood waters also redistributed hydrocarbons from legacy spill sites, wellheads and artisanal refining points across farmland, fishponds and creeks, converting a hydrometeorological hazard into a compound environmental and public-health emergency (Fentiman & Zabbey, 2015; Sam & Zabbey, 2018).
Events of this type belong to the class of Natech events — technological accidents triggered by natural hazards. The Natech literature has established that floods are among the most damaging natural triggers for process industries because they act simultaneously on many components, defeat conventional single-point safety logic, disable utilities and emergency response access, and can cause multiple, spatially distributed loss-of-containment events (Cruz & Krausmann, 2013; Krausmann et al., 2017; Ricci et al., 2023). Quantitative Natech methods now provide vulnerability models and probit or fragility relationships for flood loading on storage tanks and other equipment (Landucci et al., 2012, 2014; Lanzano et al., 2017). Yet these methods have rarely been applied in the Niger Delta, where most flood research remains focused on community exposure, land use and social vulnerability rather than on the engineered petroleum system itself (Ologunorisa, 2004; Nkeki et al., 2013); (Nkwunonwo et al., 2020).
This paper addresses that gap. Its objectives are to:
-
quantify the topographic exposure of the Niger Delta land surface and of its major petroleum facilities using open, globally consistent elevation data;
-
characterise observed hydro-climatic change in delta precipitation over 1981–2024 and identify the dominant flood-generating drivers;
-
construct a transparent, reproducible composite flood vulnerability index (CFVI) that combines hazard, exposure and asset-density indicators at state level;
-
estimate the physical vulnerability of facility components using flood fragility functions adapted from the Natech literature, and identify the components that govern loss of function; and
-
translate the results into a climate-resilient engineering and disaster-risk-management framework
— design flood levels, freeboard, buoyancy and scour checks, Natech-aware shutdown logic, early warning, and an adaptation portfolio — that is implementable under Nigerian regulatory conditions.
The contribution is deliberately screening-level and reproducible: all inputs are open datasets, all processing steps are scripted, and the intention is to give operators, regulators and researchers a defensible first-pass prioritization that identifies where detailed hydrodynamic modelling and site-specific engineering assessment should be invested.
2. Study area
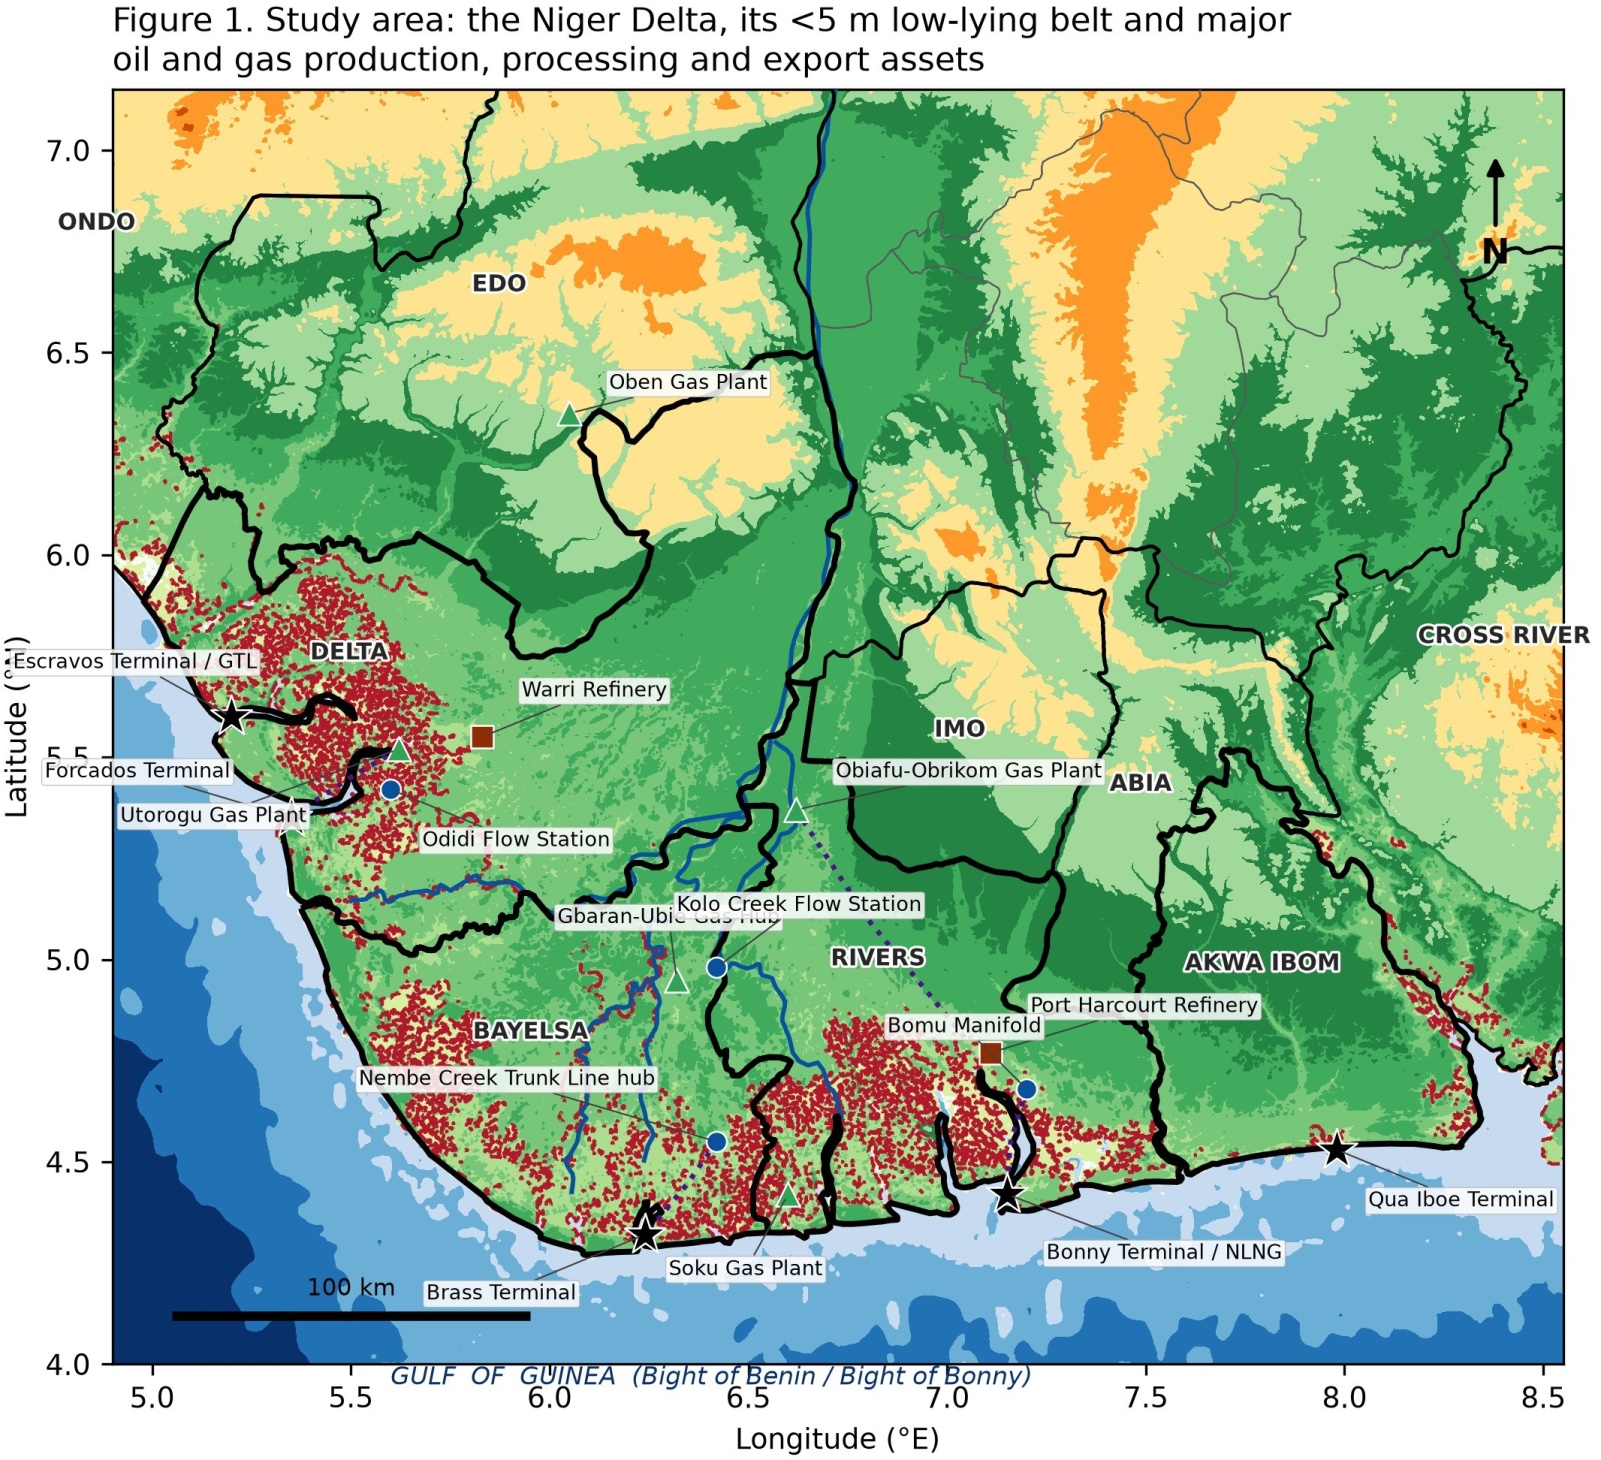
The Niger Delta, as defined administratively by Nigeria's Niger Delta Development Commission mandate, comprises nine states: Abia, Akwa Ibom, Bayelsa, Cross River, Delta, Edo, Imo, Ondo and Rivers. The hydrological and geomorphological delta proper — the arcuate, mangrove-fringed depositional plain built by the Niger and its distributaries — is concentrated in Bayelsa, Rivers, Delta and western Akwa Ibom (Figure 1). The delta receives 1,800–2,700 mm of rainfall annually, with a pronounced wet season from June to October, a short August "little dry season" in parts of the western delta, and a hydrograph that peaks in September–October when local rainfall, upstream Niger–Benue flood waves and spring tides can coincide (Abam, 2001; Adejuwon, 2018).
Three geophysical characteristics make the region intrinsically flood-prone. First, the terrain is extremely low: much of the mangrove and freshwater swamp belt lies within a few metres of mean sea level, so small changes in water level translate into large changes in inundated area. Second, the delta is subsiding and sediment-starved: upstream impoundment, canalisation, dredging and hydrocarbon withdrawal reduce aggradation while increasing compaction, so relative sea-level rise exceeds the global mean rate, the mechanism identified globally by Syvitski et al. (2009) and Nicholls et al. (2021). Third, natural buffers are being lost: mangrove cover has declined substantially through clearance, oil pollution and the invasion of Nypa fruticans (Nababa et al., 2020), reducing wave attenuation, sediment trapping and creek-bank stability, while wetland conversion reduces the flood storage that historically absorbed the annual pulse (Adekola & Mitchell, 2011).
Superimposed on this physical setting is one of the densest concentrations of hydrocarbon infrastructure in Africa, much of it built on hydraulically filled pads inside the swamp, accessible only by boat or helicopter, and dependent on long, exposed pipeline corridors that cross rivers, creeks and tidal channels. The coincidence of extreme lowland topography, high asset density and constrained emergency access is the defining risk signature of the region.
3. Materials and methods
3.1 Research design
The study uses a four-stage, screening-level risk architecture consistent with the hazard × exposure × vulnerability formulation adopted in the flood risk and Natech literature (Maranzoni et al., 2022; Krausmann et al., 2017): (i) hazard characterisation from observed precipitation and documented compound drivers; (ii) exposure quantification from digital elevation data and a compiled asset inventory;
(iii) vulnerability assessment at two scales — a state-level composite index and component-level fragility functions; and (iv) translation into engineering design and DRR measures. Every quantitative step relies on open data and scripted, repeatable processing (Appendix A).
3.2 Data sources
| Dataset | Variable used | Resolution / period | Purpose | Source |
| SRTM15+ v2 | Elevation and bathymetry | 15 arc-sec (~450 m) | Hypsometry, low-lying area shares, asset screening elevation | Tozer et al. (2019) |
| NASAPOWER (MERRA-2 based) | Daily corrected total precipitation (PRECTOTCORR ) | Daily, 1981–2024, 13 points | Rainfall regime, trends, extreme indices | NASAPOWER (2025); Gelaro et al. (2017) |
| geoBoundaries v6 (gbOpen,GRID3 source) | Nigeria ADM0/ADM1 polygons | Vector, 2022 | State-level aggregationand mapping | Runfolaetal. (2020) |
| Natural Earth 10 m | Niger and Benue main-stem centrelines | Vector | Cartographic context | NaturalEarth (public domain) |
| Publicasset inventory | Locations of terminals, refineries, gas plants, flow stations and | 16 assets | Exposure screening | Compiledfrom operatorand agencypublic information |
| Dataset | Variable used | Resolution / period | Purpose | Source |
| Indicative trunk pipelines |
Four analysis locations were selected to span the delta's east–west rainfall gradient and to coincide with industrial clusters: Port Harcourt (4.82°N, 7.05°E), Yenagoa (4.92°N, 6.26°E), Warri (5.52°N, 5.75°E) and Eket/Qua Iboe (4.64°N, 7.94°E). Nine additional points at state representative centroids supplied the hydro-climatic indicators of the composite index.
3.3 Hydro-climatic analysis
Daily precipitation for 1981–2024 (16,071 days per site) was aggregated into seven indices aligned with the ETCCDI convention: annual total, July–October (peak flood season) total, Rx1day, Rx5day, days ≥ 20 mm, days ≥ 50 mm, and R95pTOT (total from days above the wet-day 95th percentile). Trends were estimated with the non-parametric Theil–Sen slope and tested with the Mann–Kendall rank correlation (τ, two-sided p), avoiding normality assumptions. Change was additionally expressed as the difference between two equal 22-year sub-periods (1981–2002 versus 2003–2024). Monthly climatologies were computed to define the flood-critical window.
3.4 Topographic exposure
SRTM15+ cells within each state polygon were extracted by spatial join, ocean cells were removed, and the share of land area below 5 m and below 10 m, the mean and the median elevation were computed per state. Delta-wide hypsometry was computed for the box 4.2–6.2°N, 5.0–8.2°E. Screening elevations for the 16 inventoried assets were read from the nearest DEM cell. Because a ~450 m cell averages topography over roughly 20 ha and cannot resolve engineered pads, dykes or spoil banks, these values are treated strictly as regional screening indicators, not as site levels; the associated uncertainty is discussed in Section 7.
3.5 Composite flood vulnerability index (CFVI)
Six indicators were normalised to [0, 1] by min–max scaling across the nine states and combined linearly:
C FV I =∑6w x
ik =1k k ,i
where xk ,i is the normalised score of indicator k in state i and wk its weight. Indicators, rationale and weights are given in Table 2. Weights were assigned by structured expert judgement in the analytic-hierarchy tradition used in comparable flood vulnerability studies (Tempa, 2022; Nkeki et al., 2013), giving primacy to the two variables that most directly control industrial flood loss — low-lying area share
(0.24) and major-asset density (0.22). A one-at-a-time sensitivity test (±50% perturbation of each weight, renormalised) was used to confirm rank stability.
| Code | Indicator | Rationale | Data source | Weight |
| I_low | Share of state land area ≤ 5 m a.s.l. | Direct control on inundation extent and depth | SRTM15+ | 0.24 |
| I_elev | Inverse of mean state elevation | Drainage gradient and backwater susceptibility | SRTM15+ | 0.14 |
| I_rain | MeanJuly–October precipitation | Seasonal hazard loadingand saturation | NASA POWER | 0.16 |
| I_rx5 | Meanannual Rx5day | Short-duration flood-generating intensity | NASA POWER | 0.12 |
| I_asset | Density of major petroleum assets | Exposure of high-consequence installations | Asset inventory | 0.22 |
| I_coast | Coastal/tidal frontage (binary) | Surge, spring-tide andsalinity backwater exposure | geoBoundaries | 0.12 |
3.6 Component fragility and Natech screening
Component vulnerability was represented by lognormal fragility functions of inundation depth above grade, d:
P( D S midd )=Φ ( ln(d /θ))
β
where θ is the median capacity (m) and β the logarithmic standard deviation. Parameters (Table 6) were adapted from published flood damage models and vulnerability regressions for atmospheric and horizontal storage vessels (Landucci et al., 2012, 2014) and from documented damage thresholds for
electrical, instrumentation and rotating equipment in industrial flood events (Cruz & Krausmann, 2013; Krausmann et al., 2017). They are explicitly illustrative: they support relative ranking of components and identification of the governing failure path, not absolute loss estimation for a specific installation.
Five inundation scenarios were evaluated (0.5, 1.0, 2.0, 3.0 and 4.5 m), the 2.0 m case being representative of the depths reported across large parts of the lower delta in the 2012 and 2022 events, and the 4.5 m case representing an extreme compound event combining an exceptional upstream flood wave, spring tide and local rainfall.
3.7 Adaptation screening
Ten candidate measures spanning structural, operational, nature-based and transformational categories were scored for expected risk-reduction effectiveness, indicative relative capital cost and design life, and ranked by a benefit–cost proxy (effectiveness divided by relative cost). These values are decision-screening placeholders intended to structure the appraisal sequence; site-specific cost–benefit analysis with monetized expected annual damage is required before investment (Hallegatte, 2009; Helmrich & Chester, 2020).
4. Results
4.1 Physical setting and asset exposure
Figure 1 presents the study area with the SRTM15+ elevation field, the 5 m contour that delimits the low-lying belt, the nine Niger Delta states, and the 16 inventoried petroleum assets with indicative trunk pipeline corridors. The mapped 5 m contour follows the mangrove and freshwater swamp belt and encloses the entire coastal terminal cluster from Escravos in the west to Qua Iboe in the east.
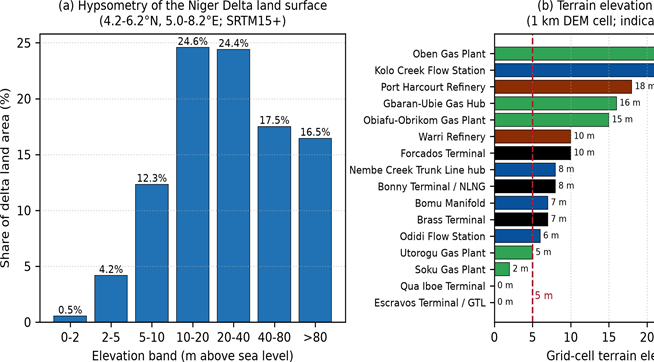
The hypsometric analysis (Figure 2a) shows that 1.0% of the delta land surface within 4.2–6.2°N, 5.0–
8.2°E lies at or below 2 m, 7.6% at or below 5 m, 19.0% at or below 10 m and 44.4% at or below 20 m. Because hydraulic gradients in the lower delta are of the order of centimetres per kilometre, this
hypsometry implies that moderate increases in flood stage propagate very far inland along creeks and canalised channels.
Screening elevations at asset locations (Figure 2b, Table 3) place five of the 16 assets at or below 5 m, and 11 at or below 10 m. Only Oben gas plant, on the northern Edo margin of the basin, sits well above the flood-prone belt (166 m). The critical point is not the absolute value of any single figure — which the DEM resolution cannot support — but the systematic pattern: the assets with the greatest national economic consequence (export terminals, LNG, gas gathering hubs) are concentrated in the lowest elevation band.
| Asset | Type | Screening elevation (m a.s.l.) | Exposure class |
| EscravosTerminal/ GTL | Export terminal / GTL | 0 | Very high |
| Qua Iboe Terminal | Export terminal | 0 | Very high |
| Soku Gas Plant | Gas plant | 2 | Very high |
| Asset | Type | Screening elevation (m a.s.l.) | Exposure class |
| Utorogu Gas Plant | Gas plant | 5 | High |
| Odidi Flow Station | Flow station | 6 | High |
| Brass Terminal | Export terminal | 7 | High |
| Bomu Manifold | Manifold | 7 | High |
| BonnyTerminal/ NLNG | Export terminal / LNG | 8 | High |
| Nembe Creek trunk line hub | Trunk line hub | 8 | High |
| Forcados Terminal | Export terminal | 10 | High |
| Warri Refinery | Refinery | 10 | High |
| Obiafu–ObrikomGas Plant | Gas plant | 15 | Moderate |
| Gbaran–Ubie Gas Hub | Gas hub | 16 | Moderate |
| Port Harcourt Refinery | Refinery | 18 | Moderate |
| KoloCreekFlow Station | Flow station | 22 | Moderate |
| Oben Gas Plant | Gas plant | 166 | Low |
4.2 Rainfall regime and observed hydro-climatic change
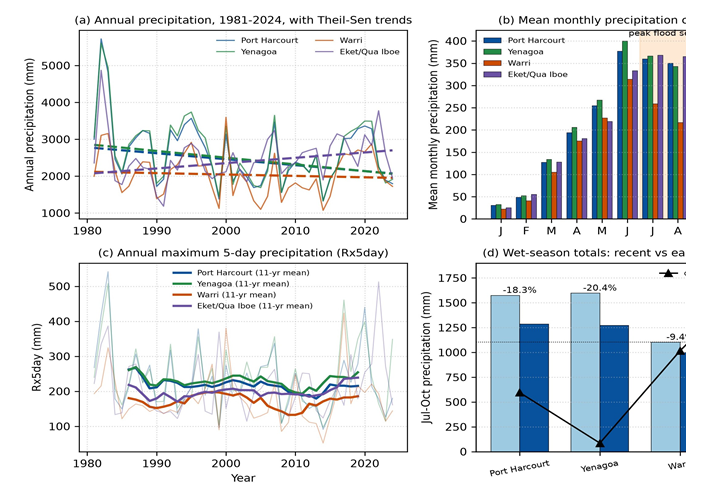
The delta's precipitation cycle is strongly seasonal (Figure 3b): monthly means exceed 300 mm from June to October at Port Harcourt, Yenagoa and Eket, and the July–October window supplies 51–56% of annual rainfall. September is the wettest month at all four locations, coinciding with the arrival of the Niger–Benue flood wave in the lower delta — the physical basis of the compound flood season.
Trend results (Figure 3a, 3c, 3d; Table 4) are heterogeneous and, in most cases, not statistically significant. Annual totals decline at Port Harcourt (−161 mm decade⁻¹, τ = −0.167, p = 0.110), Yenagoa (−183 mm decade⁻¹, τ = −0.165, p = 0.115) and Warri (−38 mm decade⁻¹, p = 0.571), and increase at Eket/Qua Iboe (+145 mm decade⁻¹, τ = 0.201, p = 0.055). The only trends significant at the 5% level are a decrease in moderate-rain days (≥ 20 mm) at Port Harcourt (−4.3 d decade⁻¹, τ = −0.220, p = 0.037) and an increase in heavy-rain days (≥ 50 mm) at Eket/Qua Iboe (+0.7 d decade⁻¹, τ = 0.225, p = 0.041). Rx1day rose at all four locations between the two 22-year sub-periods (+9.8% to +33.3%) even where totals fell, indicating a tendency toward fewer but more concentrated rain days in the western delta and toward wetter and more intense conditions in the east.
≥ 50 mm.
| Index | Site | 1981– 2002 mean | 2003– 2024 mean | Change (%) | Theil–Sen slope (per decade) | Kendall τ | p |
| Annual total (mm) | Port Harcourt | 2,903.5 | 2,344.6 | −19.2 | −161.4 | −0.167 | 0.110 |
| Annual total (mm) | Yenagoa | 2,992.5 | 2,385.5 | −20.3 | −182.6 | −0.165 | 0.115 |
| Annual total (mm) | Warri | 2,184.6 | 1,921.3 | −12.1 | −37.7 | −0.059 | 0.571 |
| Annual total (mm) | Eket/Qua Iboe | 2,367.9 | 2,626.6 | +10.9 | +144.7 | 0.201 | 0.055 |
| Jul–Oct total (mm) | Port Harcourt | 1,574.4 | 1,286.6 | −18.3 | −114.4 | −0.167 | 0.110 |
| Jul–Oct total (mm) | Yenagoa | 1,596.9 | 1,271.2 | −20.4 | −127.4 | −0.186 | 0.075 |
| Jul–Oct total (mm) | Eket/Qua Iboe | 1,293.6 | 1,504.2 | +16.3 | +63.8 | 0.156 | 0.134 |
| Rx1day (mm) | Yenagoa | 78.7 | 104.9 | +33.3 | +0.5 | 0.019 | 0.856 |
| Rx1day (mm) | Eket/Qua Iboe | 86.3 | 95.1 | +10.1 | +8.2 | 0.188 | 0.072 |
| Rx5day (mm) | Port Harcourt | 240.6 | 214.4 | −10.9 | −12.5 | −0.123 | 0.241 |
| Days ≥ 20 | Port | 41.3 | 26.3 | −36.2 | −4.3 | −0.220 | **0.037** |
| Index | Site | 1981– 2002 mean | 2003– 2024 mean | Change (%) | Theil–Sen slope (per decade) | Kendall τ | p |
| mm | Harcourt | ||||||
| Days ≥ 50 mm | Eket/Qua Iboe | 3.3 | 4.7 | +44.4 | +0.7 | 0.225 | **0.041** |
| R95pTOT (mm) | Yenagoa | 784.8 | 543.6 | −30.7 | −76.7 | −0.139 | 0.185 |
The interpretation is central to the paper's argument. Local rainfall is a necessary but insufficient explanation of catastrophic delta flooding. Reanalysis-based local trends are weak and spatially inconsistent, whereas the two most damaging recent floods were generated by basin-scale discharge from the Niger and Benue combined with reservoir operations, sustained backwater in the distributaries, and high tidal stages. Design and early-warning systems that monitor only local rainfall will therefore systematically underestimate the hazard; the operative variables are upstream discharge and dam-release schedules, coastal water level, and the state of drainage and buffer systems (Abam, 2001; Wahl et al., 2015; Almar et al., 2021).
| Event | Reported deaths | Reported displaced / affected | States affected | Reported consequences for petroleum operations |
| 2012(Niger–Benue flood) | ~360 | ~2.1million displaced; ~7 million affected | ~30 of 36 | Inundation of flow stations and access routes; production deferment; workforce evacuation; national economic loss estimated in the order of NGN 2.6 trillion |
| 2018 | ~200 | ~1.9million | ~12 | Localised facility |
| Event | Reported deaths | Reported displaced / affected | States affected | Reported consequences for petroleum operations |
| affected | flooding; road and logistics disruption | |||
| 2022(most extensive in lower delta) | 600+ | ~1.4million displaced; >2 million affected; >200,000 houses damaged | 33 | Facilityand terminalaccess flooding; defermentand force-majeure reporting; redistributionof legacy hydrocarbon contamination |
| 2024 | ~300(nationally, dominatedby north-eastdam failure) | >1million affected | 30+ | Limiteddirect deltafacility damage; sector-wide reinforcementof flood contingency planning |
Note. Values in this table are drawn from national emergency management and humanitarian situation reporting and post-disaster assessments; published figures differ between sources and reporting dates, and readers are advised to verify against the latest official releases before citation. They are included to establish the order of magnitude of consequence, not as precise measurements.
4.3 State-level composite vulnerability
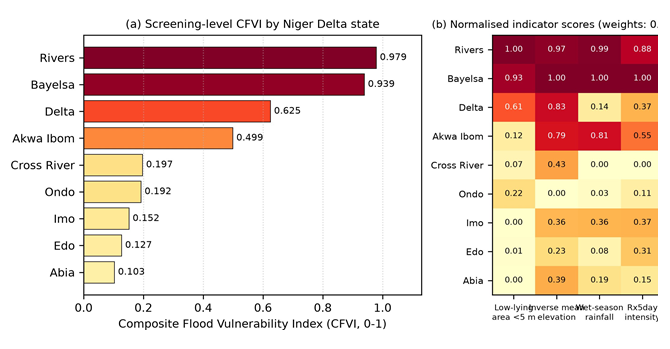
The CFVI (Figure 4, Table 5) separates the nine states into three clear tiers. Rivers (0.979) and Bayelsa (0.939) form a very high tier: they combine the largest low-lying fractions (15.3% and 14.2% of land area at or below 5 m; 34.1% and 38.4% at or below 10 m), the highest wet-season rainfall (1,430 mm and 1,434 mm), the highest Rx5day values (227 mm and 241 mm), coastal frontage, and the densest
concentration of major assets. Delta State (0.625) forms a high tier on account of extensive low-lying terrain (9.4% at or below 5 m), coastal frontage and four major assets, moderated by drier centroid conditions. Akwa Ibom (0.499) is intermediate: rainfall and coastal exposure are high but the low-lying fraction is small (1.8%). Cross River (0.197), Ondo (0.192), Imo (0.152), Edo (0.127) and Abia (0.103) form a moderate-to-low tier in which flood impacts are real but concentrated in riparian corridors rather than across the industrial estate.
| State | Land ≤ 5 m (%) | Land ≤ 10 m (%) | Mean elevatio n (m) | Jul–Oct rainfall (mm) | Rx5day (mm) | Major assets (n) | Coastal | CFVI | Rank |
| Rivers | 15.3 | 34.1 | 18.4 | 1,430 | 227 | 5 | Yes | 0.979 | 1 |
| Bayelsa | 14.2 | 38.4 | 13.9 | 1,434 | 241 | 4 | Yes | 0.939 | 2 |
| Delta | 9.4 | 23.4 | 36.3 | 1,044 | 169 | 4 | Yes | 0.625 | 3 |
| State | Land ≤ 5 m (%) | Land ≤ 10 m (%) | Mean elevatio n (m) | Jul–Oct rainfall (mm) | Rx5day (mm) | Major assets (n) | Coastal | CFVI | Rank |
| Akwa Ibom | 1.8 | 8.6 | 42.0 | 1,350 | 190 | 1 | Yes | 0.499 | 4 |
| Cross River | 1.1 | 5.0 | 89.1 | 983 | 127 | 0 | Yes | 0.197 | 5 |
| Ondo | 3.4 | 9.4 | 145.0 | 996 | 140 | 0 | Yes | 0.192 | 6 |
| Imo | 0.0 | 0.0 | 98.3 | 1,147 | 169 | 0 | No | 0.152 | 7 |
| Edo | 0.1 | 0.5 | 115.5 | 1,021 | 162 | 1 | No | 0.127 | 8 |
| Abia | 0.0 | 0.0 | 94.3 | 1,069 | 144 | 0 | No | 0.103 | 9 |
The ranking is robust: perturbing any single weight by ±50% and renormalizing leaves the top three states unchanged, because Rivers and Bayelsa score highly on every indicator simultaneously rather than on one dominant term. The clear implication for asset management is that flood resilience capital should be allocated first to the Rivers–Bayelsa–Delta corridor, and that within that corridor the binding constraint is not the presence of hazard — which is universal — but the criticality and fragility of the specific components exposed.
4.5 Component fragility and the governing failure path
Figure 5 and Table 6 give the fragility results. At 0.5 m inundation — a depth reached in almost any drainage failure or nuisance flood — electrical substations, motor control centres and switchgear already have a conditional damage probability of 0.34, rising to 0.87 at 1.0 m and effectively certainty (>0.99) at
2.0 m. Instrumentation and control rooms reach 0.58 at 1.0 m. Rotating equipment (pumps, compressors, drivers) reaches 0.36 at 1.0 m and 0.92 at 2.0 m. Unanchored atmospheric storage tanks with low liquid fill — the configuration most susceptible to buoyancy uplift and shell buckling — reach 0.5 at 1.6 m and
0.66 at 2.0 m. Wellheads and manifold assemblies, being compact and heavy, reach 0.5 only near 2.6 m, and anchored high-fill tanks and heavy pressure vessels near 4.2 m.
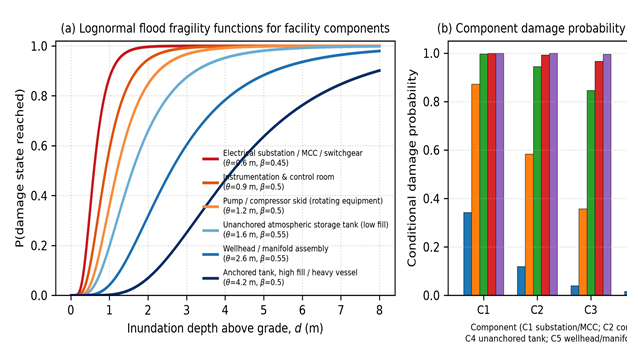
(b) conditional damage probability under five inundation scenarios. Parameters adapted from Landucci et al. (2012, 2014).
| Code | Component | Median capacity θ (m) | β | Dominant damage mechanism | P(damage ) at 1 m | P at 2 m | P at 4.5 m |
| C1 | Electrical substation / MCC / switchgear | 0.6 | 0.45 | Immersion of energised equipment , insulation failure, lossof power | 0.87 | 1.00 | 1.00 |
| C2 | Instrument ationand | 0.9 | 0.50 | Lossof control, | 0.58 | 0.94 | 1.00 |
| Code | Compone nt | Median capacity θ (m) | β | Dominant damage mechanis m | P(damage ) at 1 m | P at 2 m | P at 4.5 m |
| control room | monitorin g and ESD actuation | ||||||
| C3 | Pump / compresso r skid | 1.2 | 0.50 | Bearing and motor immersion , misalignm ent, debris ingress | 0.36 | 0.85 | 1.00 |
| C4 | Unanchore d atmospher ictank, low fill | 1.6 | 0.55 | Buoyancy uplift, shell buckling, connection rupture | 0.20 | 0.66 | 0.97 |
| C5 | Wellhead / manifold assembly | 2.6 | 0.55 | Hydrodyn amicand debris loading, scourof the pad | 0.04 | 0.32 | 0.84 |
| C6 | Anchored tank, high fill / heavy vessel | 4.2 | 0.50 | Hydrostati cand debris loading, foundation scour | 0.00 | 0.07 | 0.55 |
The practical consequence is that the governing failure path in a delta flood is loss of function before loss of containment. Power, control and rotating equipment are disabled at depths far below those required to damage primary containment; once they fail, the facility loses monitoring, drainage pumping and remote isolation precisely when hydrodynamic loads and debris impact on containment are still rising. This inverts the conventional design emphasis, which concentrates protective effort on vessels and pipework. It also explains a repeated observation in Natech case studies: flood damage costs are dominated by long restoration times for electrical and instrumentation systems and by the consequences of losing control authority, rather than by structural collapse (Cruz & Krausmann, 2013; Krausmann, 2017).
Four compound damage pathways follow from the fragility ordering and from documented delta conditions:
-
Buoyancy and flotation. Partially filled atmospheric tanks, sumps, separators and underground vessels can uplift when the submerged depth exceeds the equilibrium condition governed by unit weight and ballast; the resulting displacement shears nozzles and connected pipework, causing loss of containment at low water depth (Landucci et al., 2012, 2014).
-
Scour and exposure of buried pipelines. Flood flow through creeks and canalised channels increases bed shear at river crossings, exposing and free-spanning previously buried lines, inducing vortex-induced vibration and bending stress; loss of cover also removes the protection that suppresses third-party interference.
-
Loss of power, control and drainage. Immersion of substations and control rooms disables ESD actuation, level and pressure monitoring, and pad-drainage pumps, converting a contained flood into an uncontrolled one.
-
Contaminant mobilisation. Flood waters entrain hydrocarbons from legacy spill sites, sludge pits, wellheads and artisanal refining points and disperse them across floodplains, farmland and fishponds, extending the impact footprint well beyond the facility fence and complicating post-event remediation (Fentiman & Zabbey, 2015; Sam & Zabbey, 2018).
4.4 Adaptation option screening
Figure 6 arrays the ten candidate measures by expected risk-reduction effectiveness against indicative relative cost. Three groups emerge. Low-cost operational measures — flood-triggered controlled shutdown procedures (benefit–cost proxy 1.52) and impulse-based early warning fed by upstream discharge and dam-release information (2.00) — dominate the screening ranking, because they reduce a large share of consequence at very low capital cost, provided the institutional arrangements to receive and act on warnings exist. Targeted structural retrofits form a middle group: dry flood-proofing of electricity houses and control rooms (0.89), mangrove and wetland buffer restoration (0.47), tank anchoring and
buoyancy restraint (0.61), scour protection at pipeline water crossings (0.45), automated ESD and remote isolation (0.41) and raising critical decks above the design flood level (0.38). Large perimeter works (ring levees, 0.21) and managed relocation of non-critical surface facilities (0.14) offer the highest effectiveness but at costs that only detailed site-specific appraisal can justify — and levees carry the residual-risk penalty of catastrophic behaviour when overtopped.
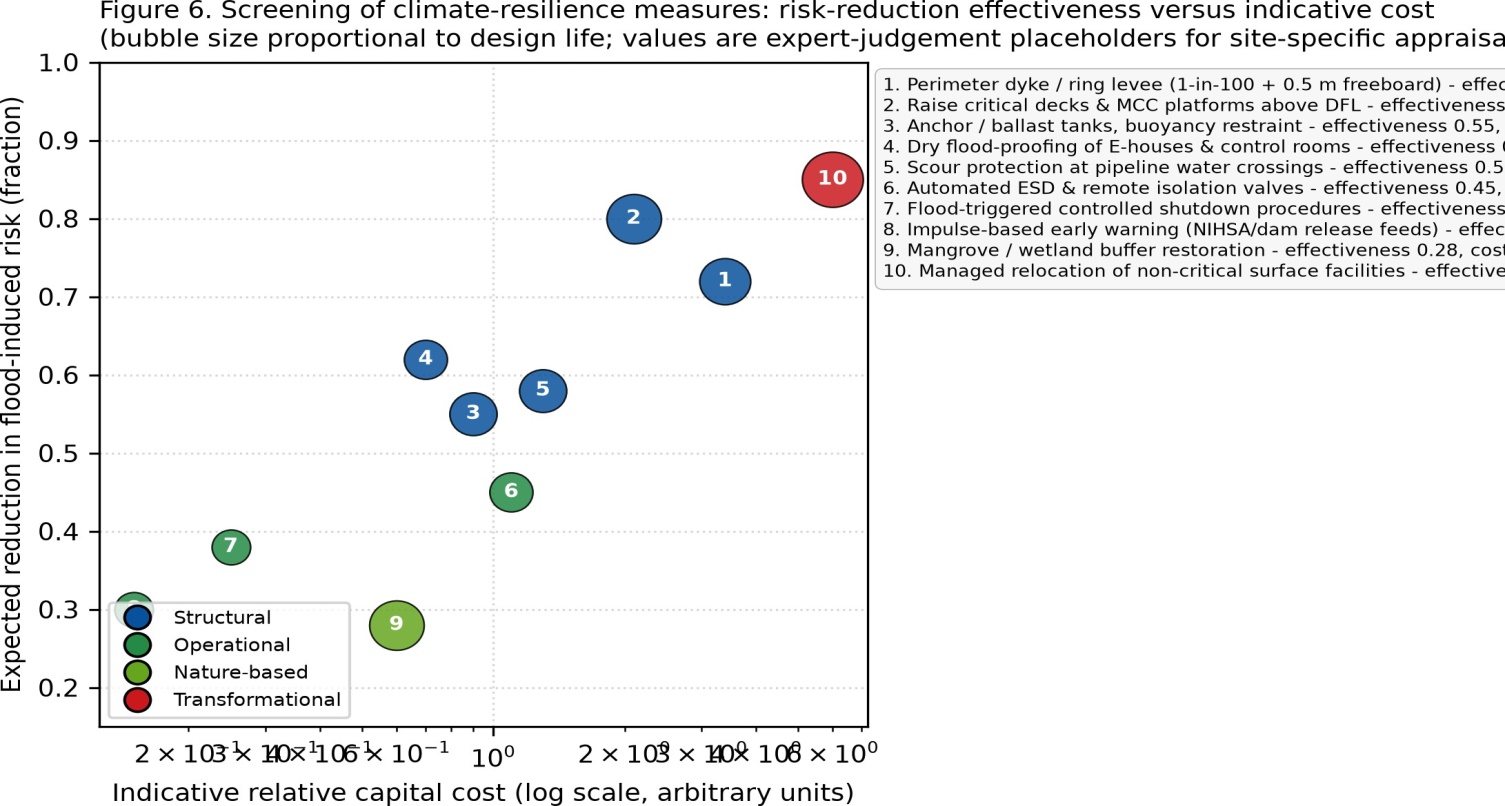
The ordering carries a clear engineering message: the highest-value first actions are informational and procedural, and the first capital to commit should protect the components that fail first — electrical, instrumentation and control systems — rather than the components that are most visible.
5. Discussion
5.1 Why the delta's flood problem is not primarily a rainfall problem
The most policy-relevant result of this study is negative: over 1981–2024, reanalysis-based local precipitation shows no coherent, statistically significant intensification across the delta, and in the western delta annual and wet-season totals declined. Yet the two most damaging floods on record occurred in this
same period. The resolution of that apparent paradox is that delta flood stage integrates four largely independent drivers.
The first is basin-scale discharge. The Niger–Benue system drains a catchment of continental scale, so flood waves entering the delta reflect rainfall over the Sahel and central Nigeria, not local conditions, with lags of weeks (Abam, 2001). The second is reservoir operation: releases from upstream storage, including transboundary releases, can superimpose an operational peak on a natural one. The third is coastal water level. Relative sea-level rise in deltas is amplified by subsidence from compaction, drainage and fluid withdrawal, so backwater and tidal blocking of distributaries intensify even without any change in rainfall (Syvitski et al., 2009; Nicholls et al., 2021; Almar et al., 2021). Compound events — the coincidence of high discharge with high coastal water level — produce flood stages far above those implied by either driver alone, a mechanism now well documented for coastal cities and deltas globally (Wahl et al., 2015; Edmonds et al., 2020). The fourth is the progressive loss of conveyance and storage: canalisation and dredging, mangrove clearance and Nypa invasion, wetland conversion, and blocked or undersized drainage across industrial pads and access roads (Nababa et al., 2020; Adekola & Mitchell, 2011).
From an engineering standpoint this reframes the design problem. A facility flood assessment that begins from local intensity–duration–frequency statistics is not merely incomplete; it is calibrated on the least informative driver. Design flood levels in the delta must be derived from joint probability analysis of upstream discharge and coastal water level, conditioned on subsidence and land-use trajectories, and re-derived periodically rather than fixed at commissioning (Hallegatte, 2009; Helmrich & Chester, 2020).
Implications for asset integrity and process safety
The fragility results direct attention to the components that the industry's design codes historically treat as ancillary. Electrical rooms, motor control centres, switchgear, UPS and instrument racks are typically placed at grade or in low structures for accessibility and cable routing, and they are the first to fail. Their failure has three compounding effects: loss of remote isolation and ESD actuation; loss of the pad-drainage pumping that keeps the site dry; and loss of situational awareness at the moment when operators most need it. Natech studies repeatedly identify this cascade — the simultaneous, spatially distributed loss of utilities and control — as the feature that distinguishes flood-triggered accidents from conventional process accidents (Cruz & Krausmann, 2013; Krausmann et al., 2017; Ricci et al., 2023).
A second implication concerns containment under low-probability, high-consequence configurations. Buoyancy uplift of partially filled tanks and sumps is a design condition that Nigerian facility inspection regimes rarely check explicitly, although the physics is simple and the mitigation — hold-down anchorage, ballasting protocols, and operating procedures that maintain minimum liquid level ahead of the flood season — is inexpensive (Landucci et al., 2012, 2014). A third concerns pipelines: flood-driven scour at water crossings removes cover, creates free spans and increases the exposure of lines to both
hydrodynamic loading and third-party interference, so post-flood integrity campaigns should include bathymetric and depth-of-cover resurveys at all crossings rather than only leak detection.
5.3 Interaction with pollution, livelihoods and legitimacy
Flooding in the Niger Delta does not act on a clean industrial landscape. Decades of spills, sludge pits and, more recently, artisanal refining have left a large inventory of mobile hydrocarbons in soils, sediments and creek banks. Flood waters mobilise and redistribute this inventory, so a hydrometeorological event becomes a diffuse contamination event affecting farmland, fishponds, drinking-water sources and mangrove nurseries (Fentiman & Zabbey, 2015; Sam & Zabbey, 2018). Remediation experience in Ogoniland demonstrates how difficult and contested post-contamination recovery becomes once contamination is dispersed and once community trust has eroded (Fentiman & Zabbey, 2015; Sam & Zabbey, 2018).
This has two consequences for resilience planning. Operationally, flood contingency plans must include contaminant-mobilisation scenarios — pre-season securing of sludge pits and waste inventories, post-flood soil and water sampling programmes, and rapid community notification. Institutionally, resilience investment that protects only the plant while leaving host communities exposed will not deliver operational continuity, because the workforce, access routes and social licence on which production depends are community-based. Resilience in this setting is unavoidably a shared-infrastructure problem: drainage, embankments, early warning and evacuation capacity have to be planned jointly by operators, state governments and communities (Linkov et al., 2014).
5.4 A climate-resilient engineering framework
Synthesising the results, we propose a five-element framework.
-
Criticality-differentiated design flood level (DFL). Replace a single site flood elevation with asset-class DFLs derived from joint discharge–water-level probability analysis, plus an explicit climate allowance and a subsidence allowance over the remaining design life (Table 7). Consequence class, not convenience, should set the return period.
-
Component-first retrofit hierarchy. Sequence capital by fragility, not by asset value: elevate or dry-flood-proof electrical and control assets first; anchor and ballast tanks and sumps second; protect crossings against scour third; consider perimeter works last, and only where residual-risk behaviour under overtopping has been analysed.
-
Natech-aware operating logic. Extend ESD philosophy to a flood-specific mode: pre-defined trigger levels drawn from upstream gauges and dam-release notifications; staged production curtailment and controlled depressurisation; remote isolation valves powered from elevated, flood-independent supplies; minimum-inventory and minimum-fill rules ahead of the flood season; and post-flood re-entry criteria that assume electrical and instrumentation systems are compromised until proven otherwise.
-
Monitoring and early warning integration. Institutionalise data exchange between operators and the national hydrological and meteorological services so that facility trigger levels respond to basin-scale forecasts and reservoir operations. Complement gauges with satellite flood mapping, which now provides an operationally useful record of observed inundation (Tellman et al., 2021).
-
Adaptive pathways and nature-based buffers. Treat resilience as a sequence of decisions with review points tied to observed relative sea level, subsidence and flood frequency, rather than as a one-off design (Hallegatte, 2009; Helmrich & Chester, 2020). Pair engineered measures with mangrove and wetland restoration, which provides wave attenuation, sediment retention and bank stability, and which
— unlike a levee — does not fail catastrophically.
| Asset criticality class | Examples | Recommended design return period | Climate + subsidence allowance | Freeboard above DFL | Verification requirement |
| C-1 Catastrophic | Export terminals, LNGtrains, refineries, majorgas plants | 1-in-500 joint (discharge × water level) | Site RSLR projection to end of life, minimum 0.5 m | 1.0 m | Full hydrodynamic model+ compound joint-probability study |
| C-2 Major | Gas gathering hubs, trunk-line manifolds, tank farms | 1-in-200 joint | Minimum0.4 m | 0.8 m | Hydrodynamic model, calibratedto 2012/2022 observed extents |
| C-3 Significant | Flow stations, pump/compres sor stations, bulk chemical storage | 1-in-100 joint | Minimum0.3 m | 0.6 m | Regional model + local survey |
| C-4 Moderate | Wellhead pads, small | 1-in-50 | Minimum0.2 m | 0.4 m | Screening (DEM + gauge |
| Asset criticality class | Examples | Recommended design return period | Climate + subsidence allowance | Freeboard above DFL | Verification requirement |
| manifolds, field logistics | record) | ||||
| C-5 Support | Accessroads, laydown areas, non-critical buildings | 1-in-25 | Minimum0.2 m | 0.3 m | Screening |
Note. DFL = design flood level; RSLR = relative sea-level rise. The table is a proposed engineering convention for discussion and calibration, not an existing regulatory requirement.
5.5 Regulatory and disaster-risk-governance implications
Nigeria's petroleum regulatory architecture, reorganized under the Petroleum Industry Act 2021, provides an opening for embedding climate resilience in field development plans, environmental evaluation reports and integrity management systems. Four measures would have disproportionate effect: (i) mandatory flood vulnerability assessment, using compound joint-probability hazard definitions, as a condition of field development plan approval and periodic integrity revalidation; (ii) mandatory Natech scenarios in facility safety cases and emergency response plans, including loss of power and control; (iii) a national register of flood-critical petroleum assets, tied to state and local emergency planning under Nigeria's disaster-management institutions and consistent with the Sendai Framework's emphasis on critical-infrastructure resilience (UNDRR, 2015); and (iv) formal data-sharing obligations between hydrological services and operators for forecasts and reservoir-release notifications. Because the sector is capital-intensive and long-lived, the marginal cost of designing new facilities to a resilient standard is small relative to the cost of retrofitting or of deferred production.
6. Limitations
Several limitations bound the interpretation of these results, and each defines a research priority.
Precipitation data. NASA POWER precipitation derives from MERRA-2 reanalysis (Gelaro et al., 2017); reanalysis rainfall over tropical West Africa carries known biases in intensity and in the representation of convective extremes. The trends reported here should be interpreted as indicative of reanalysis-consistent change and validated against Nigerian Meteorological Agency gauge records and satellite–gauge blends (e.g. CHIRPS) before use in design.
Elevation data. SRTM15+ has a ~450 m cell and metre-scale vertical uncertainty, and it represents a surface that includes vegetation returns in mangrove terrain. Values in Table 3 are regional screening indicators only; site design requires LiDAR or high-accuracy GNSS survey with a defined vertical datum, and delta-wide analysis would benefit from bare-earth products.
No hydrodynamic modelling. This study does not simulate inundation. Depth, velocity, duration and debris loading — the quantities that actually drive damage — require calibrated 1D/2D hydrodynamic modelling of the distributary network with tidal boundaries, ideally validated against observed 2012 and 2022 flood extents.
Fragility parameters are transferred, not calibrated. The fragility functions are adapted from European and Chinese industrial datasets and expert judgement; they have not been calibrated on Nigerian facility damage data. Building an anonymized national database of flood-related damage, downtime and restoration cost would enable proper calibration and materially improve decision quality.
Index construction. The CFVI uses min–max normalization across only nine units, so scores are relative rather than absolute, and expert-judgement weights inevitably embed assumptions. Social vulnerability, drainage condition, asset age and maintenance state — all material to real-world outcomes — are omitted for lack of consistent open data.
Asset inventory. Facility positions are approximate, compiled from public sources, and the inventory covers major assets only; thousands of wellheads, flowlines and small facilities are not represented. Access to operator geospatial data would substantially sharpen the exposure analysis.
Reported impact figures. The historical impact values in Section 4.2 come from agency and humanitarian situation reporting; they vary between sources and are included for order of magnitude only.
7. Conclusions and recommendations
The Niger Delta's petroleum system is built in the lowest, most rapidly changing part of Africa's largest delta, and its flood exposure is structural rather than incidental. This assessment shows that 14–15% of the land area of Rivers and Bayelsa States lies at or below 5 m, that 11 of 16 major assets screened sit at or below 10 m, and that a composite of topographic, hydro-climatic, coastal and asset-density indicators identifies Rivers, Bayelsa and Delta States as the priority corridor for resilience investment. Local rainfall trends over 1981–2024 are weak and spatially inconsistent, which does not diminish the hazard but relocates its source: catastrophic flooding in the delta is a compound phenomenon driven by basin-scale discharge, reservoir operation, rising relative sea level amplified by subsidence, and the erosion of natural and engineered conveyance. Component fragility analysis shows that electrical, instrumentation and control assets fail at depths well below those that threaten containment, so loss of function — and therefore loss of control — precedes loss of containment, inverting conventional design priorities.
Six recommendations follow.
-
Redefine the design basis. Adopt compound joint-probability design flood levels with explicit climate and subsidence allowances, differentiated by consequence class (Table 7), and mandate periodic re-derivation rather than fixed commissioning values.
-
Retrofit in fragility order. Prioritise elevation and dry flood-proofing of electrical, instrumentation and control assets; then tank anchoring, ballasting and minimum-fill protocols; then scour protection at pipeline crossings.
-
Institutionalize flood-specific operating logic. Trigger-based staged curtailment, remote isolation on flood-independent power, pre-season inventory management, and post-flood re-entry protocols that presume electrical and control systems are compromised.
-
Integrate early warning. Establish formal, machine-readable data exchange between hydrological and meteorological agencies and operators covering discharge forecasts, dam-release notifications and coastal water levels, complemented by satellite inundation monitoring.
-
Invest in shared and nature-based resilience. Combine facility measures with mangrove and wetland restoration and with community drainage and evacuation capacity, recognising that operational continuity depends on the surrounding landscape and population.
-
Build the evidence base. Create a national flood-damage and downtime database for petroleum facilities, commission calibrated hydrodynamic modelling of the distributary network, and acquire LiDAR-based bare-earth elevation for the industrial belt.
The engineering task is not to defend a fixed line against a stationary hazard. It is to design, operate and govern a long-lived industrial system inside a delta whose water levels, sediment budget and land surface are all changing — which requires adaptive, criticality-differentiated, Natech-integrated resilience as a standing practice rather than a post-disaster response.
Declarations
Funding. This research received no external funding.
Conflicts of interest. The author declares no competing interests.
Data availability. All datasets used are openly available: NASA POWER daily meteorology (https://power.larc.nasa.gov), SRTM15+ v2 global topography via NOAA ERDDAP, and geoBoundaries administrative boundaries (https://www.geoboundaries.org). Derived tables, indices and the analysis scripts described in Appendix A are available from the author on request.
References
- Abam, T. K. S. (2001). Regional hydrological research perspectives in the Niger Delta. Hydrological Sciences Journal, 46(1), 13–25. DOI ↗ Google Scholar ↗
- Adejuwon, J. O. (2018). Effect of seasons on spatial variability of rainfall in the Niger Delta, Nigeria. Journal of Applied Sciences and Environmental Management, 22(10), 1701–1706. DOI ↗ Google Scholar ↗
- Adekola, O., & Mitchell, G. (2011). The Niger Delta wetlands: Threats to ecosystem services, their importance to dependent communities and possible management measures. International Journal of Biodiversity Science, Ecosystem Services & Management, 7(1), 50–68. DOI ↗ Google Scholar ↗
- Alfieri, L., Bisselink, B., Dottori, F., Naumann, G., de Roo, A., Salamon, P., Wyser, K., & Feyen, L. (2017). Global projections of river flood risk in a warmer world. Earth's Future, 5(2), 171–182. DOI ↗ Google Scholar ↗
- Almar, R., Ranasinghe, R., Bergsma, E. W. J., Diaz, H., Melet, A., Papa, F., Vousdoukas, M., Athanasiou, P., Dada, O., Almeida, L. P., & Kestenare, E. (2021). A global analysis of extreme coastal water levels with implications for potential coastal overtopping. Nature Communications, 12, 3775. DOI ↗ Google Scholar ↗
- Bruneau, M., Chang, S. E., Eguchi, R. T., Lee, G. C., O'Rourke, T. D., Reinhorn, A. M., Shinozuka, M., Tierney, K., Wallace, W. A., & von Winterfeldt, D. (2003). A framework to quantitatively assess and enhance the seismic resilience of communities. Earthquake Spectra, 19(4), 733–752. DOI ↗ Google Scholar ↗
- Cruz, A. M., & Krausmann, E. (2013). Vulnerability of the oil and gas sector to climate change and extreme weather events. Climatic Change, 121(1), 41–53. DOI ↗ Google Scholar ↗
- Edmonds, D. A., Caldwell, R. L., Brondizio, E. S., & Siani, S. M. O. (2020). Coastal flooding will disproportionately impact people on river deltas. Nature Communications, 11, 4741. DOI ↗ Google Scholar ↗
- Fentiman, A., & Zabbey, N. (2015). Environmental degradation and cultural erosion in Ogoniland: A case study of the oil spills in Bodo. The Extractive Industries and Society, 2(4), 615–624. DOI ↗ Google Scholar ↗
- Forzieri, G., Bianchi, A., Batista e Silva, F., Marin Herrera, M. A., Leblois, A., Lavalle, C., Aerts, J. C. J. H., & Feyen, L. (2018). Escalating impacts of climate extremes on critical infrastructures in Europe. Global Environmental Change, 48, 97–107. DOI ↗ Google Scholar ↗
- Gelaro, R., McCarty, W., Suárez, M. J., Todling, R., Molod, A., Takacs, L., Randles, C. A., Darmenov, A., Bosilovich, M. G., Reichle, R., Wargan, K., Coy, L., Cullather, R., Draper, C., Akella, S., Buchard, V., Conaty, A., da Silva, A. M., Gu, W., … Zhao, B. (2017). The Modern-Era Retrospective Analysis for Research and Applications, Version 2 (MERRA-2). Journal of Climate, 30(14), 5419–5454. DOI ↗ Google Scholar ↗
- Hallegatte, S. (2009). Strategies to adapt to an uncertain climate change. Global Environmental Change, 19(2), 240–247. DOI ↗ Google Scholar ↗
- Hallegatte, S., Green, C., Nicholls, R. J., & Corfee-Morlot, J. (2013). Future flood losses in major coastal cities. Nature Climate Change, 3(9), 802–806. DOI ↗ Google Scholar ↗
- Helmrich, A. M., & Chester, M. V. (2020). Reconciling complexity and deep uncertainty in infrastructure design for climate adaptation. Sustainable and Resilient Infrastructure, 5(3), 116–133. DOI ↗ Google Scholar ↗
- Justine, Y. E. D., & Seenath, A. (2025). Modelling the effectiveness of vegetative nature-based solutions for coastal flood risk mitigation. Journal of Flood Risk Management, 18(2), e70046. DOI ↗ Google Scholar ↗
- Krausmann, E., Cruz, A. M., & Salzano, E. (2017). Natech risk assessment and management: Reducing the risk of natural-hazard impact on hazardous installations. Elsevier. DOI ↗ Google Scholar ↗
- Landucci, G., Antonioni, G., Tugnoli, A., & Cozzani, V. (2012). Release of hazardous substances in flood events: Damage model for atmospheric storage tanks. Reliability Engineering & System Safety, 106, 200– DOI ↗ Google Scholar ↗
- DOI ↗ Google Scholar ↗
- Landucci, G., Necci, A., Antonioni, G., Tugnoli, A., & Cozzani, V. (2014). Release of hazardous substances in flood events: Damage model for horizontal cylindrical vessels. Reliability Engineering & System Safety, 132, 125–145. DOI ↗ Google Scholar ↗
- Lanzano, G., Basco, A., Pellegrino, A., & Salzano, E. (2017). Natural hazard characterization. In E. Krausmann, A. M. Cruz, & E. Salzano (Eds.), Natech risk assessment and management (pp. 69–89). Elsevier. DOI ↗ Google Scholar ↗
- T.(2014).Changingtheresilienceparadigm.NatureClimateChange,4(6),407–409. DOI ↗ Google Scholar ↗
- Maranzoni, A., D'Oria, M., & Rizzo, C. (2022). Quantitative flood hazard assessment methods: A review. Journal of Flood Risk Management, 16(1), e12855. DOI ↗ Google Scholar ↗
- Nababa, I. I., Symeonakis, E., Koukoulas, S., Higginbottom, T. P., Cavan, G., & Marsden, S. (2020). Land cover dynamics and mangrove degradation in the Niger Delta region. Remote Sensing, 12(21), 3619. DOI ↗ Google Scholar ↗
- Nicholls, R. J., Lincke, D., Hinkel, J., Brown, S., Vafeidis, A. T., Meyssignac, B., Hanson, S. E., Merkens, J.-L., & Fang, J. (2021). A global analysis of subsidence, relative sea-level change and coastal flood exposure. Nature Climate Change, 11(4), 338–342. DOI ↗ Google Scholar ↗
- Nkeki, F. N., Henah, P. J., & Ojeh, V. N. (2013). Geospatial techniques for the assessment and analysis of flood risk along the Niger–Benue basin in Nigeria. Journal of Geographic Information System, 5(2), 123– DOI ↗ Google Scholar ↗
- DOI ↗ Google Scholar ↗
- Nkwunonwo, U. C., Whitworth, M., & Baily, B. (2020). A review of the current status of flood modelling for urban flood risk management in the developing countries. Scientific African, 7, e00269. DOI ↗ Google Scholar ↗
- Ologunorisa, T. E. (2004). An assessment of flood vulnerability zones in the Niger Delta, Nigeria. InternationalJournalofEnvironmentalStudies,61(1),31–38. DOI ↗ Google Scholar ↗
- Ricci, F., Casson Moreno, V., & Cozzani, V. (2023). Natech accidents triggered by heat waves. Safety, 9(2), 33. DOI ↗ Google Scholar ↗
- Runfola, D., Anderson, A., Baier, H., Crittenden, M., Dowker, E., Fuhrig, S., Goodman, S., Grimsley, G., Layko, R., Melville, G., Mulder, M., Oberman, R., Panganiban, J., Peck, A., Seitz, L., Shea, S., Slevin, H., Youngerman, R., & Hobbs, L. (2020). geoBoundaries: A global database of political administrative boundaries. PLOS ONE, 15(4), e0231866. DOI ↗ Google Scholar ↗
- Sam, K., & Zabbey, N. (2018). Contaminated land and wetland remediation in Nigeria: Opportunities for sustainable livelihood creation. Science of the Total Environment, 639, 1560–1573. DOI ↗ Google Scholar ↗
- Syvitski, J. P. M., Kettner, A. J., Overeem, I., Hutton, E. W. H., Hannon, M. T., Brakenridge, G. R., Day, J., Vörösmarty, C., Saito, Y., Giosan, L., & Nicholls, R. J. (2009). Sinking deltas due to human activities. Nature Geoscience, 2(10), 681–686. DOI ↗ Google Scholar ↗
- Tellman, B., Sullivan, J. A., Kuhn, C., Kettner, A. J., Doyle, C. S., Brakenridge, G. R., Erickson, T. A., & Slayback, D. A. (2021). Satellite imaging reveals increased proportion of population exposed to floods. Nature, 596(7870), 80–86. DOI ↗ Google Scholar ↗
- Tessler, Z. D., Vörösmarty, C. J., Grossberg, M., Gladkova, I., Aizenman, H., Syvitski, J. P. M., & Foufoula-Georgiou, E. (2015). Profiling risk and sustainability in coastal deltas of the world. Science, 349(6248), 638–643. DOI ↗ Google Scholar ↗
- Tozer, B., Sandwell, D. T., Smith, W. H. F., Olson, C., Beale, J. R., & Wessel, P. (2019). Global bathymetry and topography at 15 arc sec: SRTM15+. Earth and Space Science, 6(10), 1847–1864. DOI ↗ Google Scholar ↗
- Wahl, T., Jain, S., Bender, J., Meyers, S. D., & Luther, M. E. (2015). Increasing risk of compound flooding from storm surge and rainfall for major US cities. Nature Climate Change, 5(12), 1093–1097. DOI ↗ Google Scholar ↗
- Federal Republic of Nigeria. (2021). Petroleum Industry Act, 2021. Federal Government Printer. DOI ↗ Google Scholar ↗
- NASA Langley Research Center. (2025). POWER: Prediction of Worldwide Energy Resources — daily meteorology and solar data [Data set]. National Aeronautics and Space Administration. https://power.larc.nasa.gov Google Scholar ↗
- United Nations Office for Disaster Risk Reduction. (2015). Sendai Framework for Disaster Risk Reduction 2015–2030. UNDRR. https://www.undrr.org/publication/sendai-framework-disaster-risk-reduction-2015-2030 Google Scholar ↗