Abstract
Discrete element model (DEM) parameters are crucial for accurately predicting soil properties and disturbance levels. This study aimed to provide an efficient method for accurately determining DEM parameters for paddy soil. The Hertz-Mindlin and JKR contact models were used to simulate the paddy soil, and the Plackett-Burman, the Steepest Ascent, and the Box-Behnken tests were used to determine the DEM parameters. The accuracy of the established discrete element model was evaluated using actual slump test. The Plackett-Burman test results showed that the soil surface energy, soil-soil rolling friction coefficient, and soil-steel static friction coefficient had a significant impact on the total relative error between the simulation results and the test results. Box-Behnken test optimization results show that the soil surface energy, soil-soil rolling friction coefficient, and soil-steel static friction coefficient are 0.869 J.m², 0.109, and 0.651, respectively. Comparison with actual soil slump test results shows that the calibrated DEM model has an overall relative error of 5.59% and a coefficient of variation of 3.49%. This research can provide a theoretical basis and technical support for subsequent research on soil-machine interaction mechanisms.
Keywords
discrete element model simulation slump test parameter verification model optimization
1 Introduction
Rice is one of Sierra Leone's staple crops, and paddy cultivation is a critical component of rice production (Tienan et al. 2023). Precise paddy field preparation procedures improve rice yield, irrigation uniformity, water and fertilizer use efficiency, and control weeds, insects, and diseases, promoting sustainable agricultural growth (Asmarani et al. 2023; Xing et al. 2024; Korba et al. 2024). Understanding the interaction between agricultural implements and paddy soils is key to optimizing agricultural implements and minimizing soil disturbance in paddy fields. Analytical, experimental, and numerical methods have been used to study the interaction between soil and tools (Ucgul 2023; Khosravani et al. 2023; Hashaam et al. 2023). Analytical methods are limited to simple geometries and assumptions about soil failure, while experimental methods (including field tests and laboratory soil bin tests) are time-consuming and expensive (Wang et al. 2022a; Aikins et al. 2023). Numerical methods can be used to investigate complex tool geometries and a wider range of soil dynamic parameters (Wang et al. 2022b). Discrete element modelling (DEM) can be used to simulate the mechanical behavior of discontinuous particles, such as soil, without restrictions on the size of particle displacement or tool design (Du et al. 2022; Zhang et al. 2022; Qiu et al. 2023). The discrete element method (DEM) has become a popular modelling approach in agricultural research in recent years. In 2022, Wang et al. used DEM to create a deep tillage tool-soil interaction model that accurately predicted the microscopic behavior of soil at various locations. Dilip et al. (2022) used DEM to study the effect of tine spacing on soil disturbance behavior; they found that a tine spacing of 400 mm performed better than other spacings. Kim et al. (2022) used DEM simulations to investigate how the operating depth of deep tillage tools affects their performance in clay soils. Zhou et al. (2022) used the discrete element model (DEM) to establish a paddy soil model with slump expansion as the performance indicator. They found that soil surface energy, soil-soil rolling friction coefficient, and soil-steel static friction coefficient significantly affected the overall slump expansion error between simulation and verification results. Wang et al. (2023) used DEM to simulate soil sweeping interactions and conducted field verification. Song et al. (2025) used DEM to simulate the soil loosening process induced by vibratory deep loosening equipment. Previous DEM research has primarily focused on simulating soil disturbance behavior at relatively low water content (25%). In contrast, paddy soils have significantly higher water content (>40%), viscosity, and fluidity, resulting in significantly different disturbance behaviours. However, previous literature has provided fewer DEM parameters, which are crucial for simulating paddy soil-tool interactions (Chen et al. 2023).
This study expands upon existing DEM literature, aiming to provide a more accurate simulation model for studying the interaction mechanisms between agricultural implements and paddy soil. Paddy soil slump was used as the experimental metric, based on slump tests. Test factors included Poisson's ratio, shear modulus, soil surface energy, soil-soil restitution coefficient, soil-soil static friction coefficient, soil-soil rolling friction coefficient, soil-steel restitution coefficient, soil-steel static friction coefficient, and soil-steel rolling friction coefficient. These DEM parameters were calibrated using the Plackett-Burman test, steepest ascent test, and Box-Behnken test in Design-Expert 13. Comparing the slump test and simulated values helped assess the accuracy of the DEM parameters during the calibration process. The results of this study provide a basis for selecting ideal DEM parameters for paddy soil models, thereby facilitating future research on the relationship between soil and agricultural implements to provide optimal working depth and minimize soil disturbance.
2 Materials and methods
2.1 Soil slump experiment
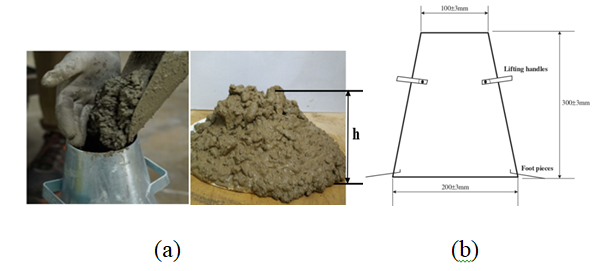
This study used the slump test as a basic test for calibrating paddy soil parameters. The paddy soil type is sandy loam with an average water content of 35.66%. The slump was used to determine the physical parameters of the paddy soil, and the slump error was used as a test indicator to calibrate the paddy soil model parameters. A slump cone was used to measure the slump height of the paddy soil. The cone was supported by a horizontal base plate and had a height of 300 mm, with upper and lower diameters of 100 mm and 200 mm, respectively. After loading, the paddy soil was compacted, and excess soil was scraped off the top of the cone. The cone was then raised at a constant speed over a period of 5 seconds. After the soil slumped, the height of the cone (h) was measured (Figure 1), and the average of five repeated measurements was recorded.
2.2 DEM contact model
Discrete element modeling (DEM) software was used to run the simulation. The Hertz-Mindlin and Johnson-Kendall-Roberts (JKR) models are commonly used for analyzing wet cohesive soils (Zhou et al. 2022; Tienan et al. 2023). This model is based on the Hertz-Mindlin (no-slip) contact model, which considers the effects of inter-particle plastic deformation and inter-particle adhesion on particle motion (Hensh et al. 2022; Jing et al. 2023; Xu et al. 2023; Siyuan and Duruo 2023). Jing et al. (2023) effectively used this contact model to simulate cohesive soils. Because paddy loam is extremely cohesive, the Hertz-Mindlin and JKR models were selected as the contact models for the discrete element soil model in this study. In the JKR contact model, the normal elastic contact force FJKR between particles is determined as follows:
The relationship between the contact radius between particles r and the degree of overlap δ, is determined as:
The equivalent contact radius R' and elastic modulus E' are determined as follows:
where, FJKR is the JKR normal contact force, N; γ - soil surface energy, J.m-2; E ' - equivalent modulus of elasticity; R ' - the equivalent contact radius, mm; V1 and V2 are the particle Poisson’s ratios; R1 and R2 are the particle radii in mm.
2.3 Model parameter calibration
Material and interaction properties are the two basic categories of soil parameters in DEM. Material properties are the basic characteristics of the soil, such as bulk density, shear modulus, particle size and shape, and Poisson's ratio. The characteristics a particle exhibits when it comes into contact with boundaries, surfaces, and other particles are known as interaction properties (Wang et al. 2023; Yuan et al. 2023). Such properties include surface energy, coefficients of restitution, static and rolling friction. According to a combination of initial testing and the literature, the nominal soil particle radius was 1 mm (Zhou et al. 2022; Aikins et al. 2023). The bulk density of the soil was obtained as 1400 kg.m-3. According to earlier studies the shear modulus, Poisson's ratio, and density of steel were calculated. The soil's shear modulus, surface energy, and Poisson's ratio, as well as the soil-soil and soil-steel coefficients of restitution, static, and rolling friction, were chosen from the literature (Table 1) (Song et al. 2022; Zhou et al. 2022; Wang et al. 2022; Tienan et al. 2023; Aikins et al. 2023).
| Symbol | Parameter | Low level (-1) | High level (1) |
| x1 | Soil poisson’s ratio | 0.3 | 0.4 |
| x2 | Soil surface energy (J.m-2) | 0.1 | 0.9 |
| x3 | Soil shear modulus (Mpa) | 0.01 | 1 |
| x4 | Soil–soil restitution coefficient | 0.01 | 0.5 |
| x5 | Soil–soil static friction coefficient | 0.1 | 0.9 |
| x6 | Soil–soil rolling friction coefficient | 0.01 | 0.11 |
| x7 | Soil–steel restitution coefficient | 0.01 | 0.6 |
| x8 | Soil–steel static friction coefficient | 0.1 | 0.9 |
| x9 | Soil–steel rolling friction coefficient | 0.01 | 0.15 |
2.4 Slump simulation test
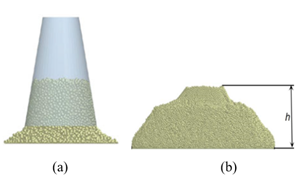
Based on the actual dimensions of the slump cone used in the slump test (Figure 1), a 1:1 scale 3D model was constructed and imported into the DEM. The slump test procedure was followed when simulating paddy soil, and the slump height of the paddy soil was measured using the post-processing features of the DEM. Using the slump height error as the test metric, the Plackett-Burman test was used to identify simulation factors that significantly affected the slump error. The steepest ascent test was used to further narrow the range of optimal values for these key factors. The Box-Behnken test was then used to develop a regression model between the test parameters and the test metric (Yuan et al., 2023). To find the ideal parameter combination, the regression equation was optimized and the results were verified by simulation. A screenshot of the particle stacking state during the slump simulation is shown in Figure 2.
The slump height error ( δ r ) was employed to determine the variance between the simulated and test slumping values. The slump error is calculated as follows:
where, he - represent test slump value, mm; hs - represent simulated slump value, mm
3 Results and discussions
3.1 Slump test results
The slump test was conducted five times, with slump values ranging from 210.77 mm to 229.5 mm, and an average of 223.92 mm, as shown in Table 2. The coefficient of variation of the slump values was 3.39%, indicating that the test results were highly accurate.
| Test number | Sampling value, h (mm) |
| 1 | 226.17 |
| 2 | 224.67 |
| 3 | 228.50 |
| 4 | 229.50 |
| 5 | 210.77 |
| Mean value | 223.922 |
| Cv (%) | 3.39 |
“CV” in the table represents coefficient of variation
3.2 Plackett-Burman test
When there are many experimental factors, the Plackett-Burman test can quickly identify those with significant impact on an indicator. Nine simulation parameters were selected for this experiment, with each parameter taking values at high and low levels (+1 and -1), as shown in Table 1. Using Design-Expert software, a Plackett-Burman test design was performed according to the parameter levels in Table 1. Table 3 shows the experimental plan and results. An analysis of variance was performed on the experimental data. Table 4 highlights the significance of each parameter's impact on the test indicator (slump height, h). The nine experimental factors are arranged in descending order of contribution to the test indicator. According to Table 4, x2, x6, and x8 contribute relatively significantly to the total relative error (δr). Therefore, the steepest ascent test and Box-Behnken test were used to calibrate these three parameters. The p-values for x2, x6, and x8 were all less than 0.05, indicating that they have an impact on the test indicators. Zhou et al. (2022) also found that, despite using a high paddy soil moisture content of >40%, soil surface energy, soil-soil rolling friction coefficient, and soil-steel static friction coefficient had a significant impact on soil slump error.
| No | x1 | x2 | x3 | x4 | x5 | x6 | x7 | x8 | x9 | Slump error (%) |
| 1 | 1 | 1 | -1 | 1 | 1 | 1 | -1 | -1 | -1 | 23.42 |
| 2 | -1 | 1 | 1 | -1 | 1 | 1 | 1 | -1 | -1 | 12.60 |
| 3 | 1 | -1 | 1 | 1 | -1 | 1 | 1 | 1 | -1 | 13.92 |
| 4 | -1 | 1 | -1 | 1 | 1 | -1 | 1 | 1 | 1 | 17.32 |
| 5 | -1 | -1 | 1 | -1 | 1 | 1 | -1 | 1 | 1 | 19.56 |
| 6 | -1 | -1 | -1 | 1 | -1 | 1 | 1 | -1 | 1 | 25.98 |
| 7 | -1 | -1 | -1 | -1 | 1 | -1 | 1 | 1 | -1 | 22.74 |
| 8 | -1 | 1 | -1 | -1 | -1 | 1 | -1 | 1 | 1 | 19.97 |
| 9 | 1 | 1 | 1 | -1 | -1 | -1 | 1 | -1 | 1 | 15.00 |
| 10 | -1 | 1 | 1 | 1 | -1 | -1 | -1 | 1 | -1 | 6.80 |
| 11 | 1 | -1 | 1 | 1 | 1 | -1 | -1 | 1 | 1 | 23.47 |
| 12 | -1 | -1 | -1 | -1 | -1 | -1 | -1 | 1 | -1 | 28.12 |
| Parameter | Effect | Sum of Squares | F | P | Rank |
| x1 | 3.70 | 16.02 | 7.35 | 0.138214 | 7 |
| x2 | -11.40 | 295.66 | 120.07 | 0.009829** | 2 |
| x3 | 2.39 | 3.85 | 2.45 | 0.434223 | 9 |
| x4 | -3.09 | 9.10 | 4.56 | 0.223781 | 8 |
| x5 | 4.00 | 20.21 | 9.04 | 0.112464 | 6 |
| x6 | -13.18 | 410.83 | 166.48 | 0.007507** | 1 |
| x7 | -4.55 | 29.43 | 12.76 | 0.080019 | 5 |
| x8 | -8.98 | 169.33 | 69.15 | 0.015963* | 3 |
| x9 | 5.09 | 40.07 | 17.05 | 0.060215 | 4 |
3.3 Steepest ascent test
To further investigate the ranges of soil parameters of x2, x6, and x8, steepest ascent test was designed and conducted to examine their impact on the total relative error (Table 4). This test was used to screen and investigate the effective ranges of these three key factors. Table 5 shows that the slump height error decreases with increasing levels of each factor. The minimum relative error (6.98%) occurs at the fourth simulation level, indicating that the ranges of x2, x6, and x8, are relatively reasonable: 0.6–1.10, 0.055–0.11, and 0.5–0.9, respectively. With the fourth simulation level as the center point, the third and fifth simulation levels serve as parameter intervals for further calibration. The resulting feasible range of soil parameters was used in subsequent Box-Behnken test.
| Test No. | x2 | x6 | x8 | Slump error (%) |
| 1 | 0.1 | 0.01 | 0.1 | 52.38 |
| 2 | 0.35 | 0.035 | 0.3 | 22.03 |
| 3 | 0.60 | 0.055 | 0.5 | 10.86 |
| 4 | 0.85 | 0.085 | 0.7 | 6.98 |
| 5 | 1.10 | 0.11 | 0.9 | 10.71 |
3.4 Box-Behnken test
The Box-Behnken test method was used to examine the specific effects of soil surface energy (x2), soil-soil rolling friction coefficient (x6), and soil-steel static friction coefficient (x8) on the slump value (h), as well as the relative error between the simulated and measured h values. The test determined the factor set that optimizes the test indicator, the slump error of paddy soil. Table 6 shows the coding of the test factors.
| Code | Factors | ||
| x2 | x6 | x8 | |
| -1 | 0.6 | 0.055 | 0.5 |
| 0 | 0.85 | 0.085 | 0.7 |
| 1 | 1.10 | 0.11 | 0.9 |
The Box-Behnken test was conducted using the parameters listed in Table 6. Table 7 shows the test plan and results. Multiple regression analysis was performed on the test results using Design-Expert software to obtain a slump error regression model and perform analysis of variance (ANOVA).
| No. | x2 | x6 | x8 | Slump error (%) |
| 1 | -1 | -1 | 0 | 16.5 |
| 2 | 1 | -1 | 0 | 5.68 |
| 3 | -1 | 1 | 0 | 12.13 |
| 4 | 1 | 1 | 0 | 9.29 |
| 5 | -1 | 0 | -1 | 20.21 |
| 6 | 1 | 0 | -1 | 9.73 |
| 7 | -1 | 0 | 1 | 9.66 |
| 8 | 1 | 0 | 1 | 8.89 |
| 9 | 0 | -1 | -1 | 10.83 |
| 10 | 0 | 1 | -1 | 19.02 |
| 11 | 0 | -1 | 1 | 12.52 |
| 12 | 0 | 1 | 1 | 7.08 |
| 13 | 0 | 0 | 0 | 5.64 |
| 14 | 0 | 0 | 0 | 4.77 |
| 15 | 0 | 0 | 0 | 6.39 |
| 16 | 0 | 0 | 0 | 4.99 |
| 17 | 0 | 0 | 0 | 5.94 |
Table 8 presents the ANOVA results of Box-Behnken test. The results showed that the effect of x6 on the slump error is not significant (P > 0.05), while the effects of x2, x8, x2x6, x2x8, x6x8, x22, x62, and x82 are all very significant (P < 0.01). The P values of the regression model and the lack of fit term of the slump error fitting are less than 0.01 and greater than 0.05, respectively, indicating that the model fits well. The coefficient of determination R2 of the regression equation was 0.9885, and the adjusted coefficient of determination adj-R2 was 0.9706. The results indicated that the regression model can be used to predict the slump of paddy soil. The optimized slump error regression equation was calculated as follows:
| Source | Sum of square | df | F-value | P-value |
| Model | 388.75 | 9 | 90.36 | < 0.0001** |
| x2 | 93.12 | 1 | 194.17 | < 0.0001** |
| x6 | 2.28 | 1 | 4.51 | 0.0871 |
| x8 | 59.36 | 1 | 123.69 | < 0.0001** |
| x2x6 | 11.52 | 1 | 23.80 | 0.0016** |
| x2x8 | 20.57 | 1 | 42.70 | 0.0059** |
| x6x8 | 52.29 | 1 | 108.92 | < 0.0001** |
| x22 | 31.28 | 1 | 65.07 | 0.0002** |
| x62 | 35.23 | 1 | 73.31 | < 0.0001** |
| x82 | 69.75 | 1 | 145.37 | < 0.0001** |
| Residual | 3.58 | 7 | ||
| Lack of Fit | 2.24 | 3 | 2.23 | 0.2864 |
| Pure Error | 1.57 | 4 | ||
| Cor Total | 392.10 | 16 |
3.5 Parameter optimization and verification
The regression model was optimized using the Design-Expert optimization tool, taking the range of test factor values as boundary conditions and the slump error as the target parameter to determine the optimal parameter combination affecting the test index. The optimization results showed a soil surface energy of 0.869 J·m⁻², a soil-soil rolling friction coefficient of 0.109, and a soil-steel static friction coefficient of 0.651. Five slump tests were conducted using the optimized x2, x6, and x8 combinations in discrete element simulations to verify the optimization results. Simulations were conducted to validate the optimized results for the ideal parameter combination (Table 9). The average error between the simulated and experimental values for slump height was 5.59%, with a coefficient of variation of 3.49%. Zhou et al. (2022) and Tienan et al. (2023), despite using different paddy soil properties, also found similar coefficients of variation. These results suggest that the paddy soil discrete element model using this parameter combination can provide fundamental information for simulation studies of soil-tool interactions.
| No | x2 | x6 | x8 | Test, h (mm) | Simulated h (mm) | Error |
| 1 | 226.17 | 213.67 | 5.53 | |||
| 2 | 224.67 | 212.17 | 5.56 | |||
| 3 | 0.869 | 0.109 | 0.651 | 228.5 | 216.00 | 5.47 |
| 4 | 229.5 | 217.00 | 5.45 | |||
| 5 | 210.77 | 198.27 | 5.93 | |||
| Average | 223.92 | 211.42 | 5.59 |
Conclusion
This study used a combination of the Plackett-Burman test, the steepest ascent test, and the Box-Behnken test to determine the DEM parameters for paddy soil using the JKR DEM model. The accuracy of the DEM model was evaluated using a slump test. For a given paddy soil model, soil surface energy (x2), soil-soil rolling friction coefficient (x6), and soil-steel static friction coefficient (x8) significantly influenced the model accuracy. Given an overall relative error of 5.59% between the slump test and the simulated values, the ideal combination of x2 of 0.869 J.m-2, x6 of 0.109, and x8 of 0.651 was obtained. These results demonstrated the accuracy of the DEM model, which can be used to establish paddy field soil simulation models and design high-performance soil tools.
References
- Aikins K.A., Ucgul M., Barr J.B., Awuah E., Diogenes L.A., Troy A.J., Jacky M.A.D. (2023). Review of Discrete Element Method Simulations of Soil Tillage and Furrow Opening. Agriculture, 13: 541. DOI ↗ Google Scholar ↗
- Asmarani S., Semedi J.M., Rustanto A. (2023). Investigating spatial relationship of soil capability and agricultural land management in Cugenang District, Cianjur Regency. IOP Conf. Series: Earth and Environmental Science, 1190: 012051. Google Scholar ↗
- Chen T., Shi Z., Wen A., Li L., Wang W. (2023). The Role of Paddy Fields in the Sediment of a Small Agricultural Catchment in the Three Gorges Reservoir Region by the Sediment Fingerprinting Method. Land, 12:875. DOI ↗ Google Scholar ↗
- Dilip J., Krishna P.S., Ravi M. (2022). Optimization of Tine Spacing of Seed Drill for Dual Banding of Fertilizer. Journal of Scientific and Industrial Research, 81: 1073-1086. Google Scholar ↗
- Du X., Liu C., Jiang M., Yuan H., Dai L., Li F., Gao Z. (2022). Calibration of bonding model parameters for coated fertilizers based on discrete element method. INMATEH –gricultural ngineering, 65(3): 255–264. Google Scholar ↗
- Hashaam M., Akram M.W., Ahmad M., Akram M.Z., Faheem M., Maqsood M., Aleem M. (2023). 3D finite element analysis of tine cultivator and soil deformation. Res. Agr. Eng., 69: 107–117. DOI ↗ Google Scholar ↗
- Hensh S., Chattopadhyay P.S., Das K. (2022). Drawbar performance of a power tiller on a sandy loam soil of the Nadia district of West Bengal. Res. Agr. Eng., 68: 41–46. DOI ↗ Google Scholar ↗
- Jing H., Hongwei W., Xiaoqiang G., Zhou Q. (2023). Particle shape effects on dynamic properties of granular soils: A DEM study. Computers and Geotechnics, 161: 105578. DOI ↗ Google Scholar ↗
- Khosravani A., Desbiolles J.M.A., Fielke J.M., Ucgul M., Saunders C. (2023). Prediction of Single Disc Seeding System Forces, Using a Semi-Analytical and Discrete Element Method (DEM). Agriculture, 13: 206. DOI ↗ Google Scholar ↗
- Kim Y.S., Lee S.D., Baek S.M., Baek S.Y., Jeon H.H., Lee J.H., Kim W.S., Shim J.Y., Kim Y.J. (2022). Analysis of the Effect of Tillage Depth on the Working Performance of Tractor-Moldboard Plow System under Various Field Environments. Sensors, 22: 2750. Google Scholar ↗
- Korba J., Brož P., Hůla J., Novák P., Novák V. (2024). Influence of soil tillage technology on tillage erosion. Research in Agricultural Engineering, 70: 104–110. Google Scholar ↗
- Qiu Y., Guo Z., Jin X., Zhang P., Si S., Guo F. (2022). Calibration and Verification Test of Cinnamon Soil Simulation Parameters Based on Discrete Element Method. Agriculture, 12: 1082. DOI ↗ Google Scholar ↗
- Siyuan Y., Duruo H. (2023). Evolution of Void Fabrics and Their Effects on Liquefaction Behaviors of Granular Soils: Insight from DEM-Clump Simulation. Journal of Engineering Mechanics, 149(6): 04023029. DOI ↗ Google Scholar ↗
- Song W., Ren L., Wang J., Ma Y., Guo Y., Han M., Zhao H. (2025). Methods for Constructing Soil Dynamic Models Under Intelligent Cultivation: Dynamic Interaction Mechanisms Between Farming Tools with Complex Structures and Soil. Agriculture, 15: 1355. Google Scholar ↗
- Tienan Z., Zhou H., Ji J., Sun F., Qin Z. (2023). Parameter calibration of the discrete element simulation model for soaking paddy loam soil based on the slump test. PLoS ONE, 18(6): e0285428. Google Scholar ↗
- Ucgul M. (2023). Simulating Soil–Disc Plough Interaction Using Discrete Element Method–Multi-Body Dynamic Coupling. Agriculture, 13: 305. Google Scholar ↗
- Wang S., Liu X., Tong T., Xu Z., Ma Y. (2023). Parameter Optimization and DEM Simulation of Bionic Sweep with Lower Abrasive Wear Characteristics. Biomimetics, 8: 201. Google Scholar ↗
- Wang X., Zhang Q., Huang Y., Ji J. (2022). An efficient method for determining DEM parameters of a loose cohesive soil modelled using hysteretic spring and linear cohesion contact models. Biosystems Engineering, 215: 283–294. DOI ↗ Google Scholar ↗
- Wang X., Zhou H., Ji J. (2022). Effect of Mounting Angle on Bending Subsoiling Tool–Soil Interactions Using DEM Simulations. Agriculture, 12: 1830. DOI ↗ Google Scholar ↗
- Xing Y., Wang X. (2024). Precision Agriculture and Water Conservation Strategies for Sustainable Crop Production in Arid Regions. Plants, 13: 3184. DOI ↗ Google Scholar ↗
- Xu T., Zhang R., Jiang X., Feng, W., Wang, Y., Wang, J. (2023). Study on Verification Approach and Multi contact Points Issue When Modeling Cyperus esculentus Seeds Based on DEM. Processes, 11: 825. DOI ↗ Google Scholar ↗
- Yuan F., Yu H., Wang L., Shi Y., Wang X., Liu H. (2023). Parameter Calibration and Systematic Test of a Discrete Element Model (DEM) for Compound Fertilizer Particles in a Mechanized Variable-Rate Application. Agronomy, 13: 706. Google Scholar ↗
- Zhang X., Zhang L., Hu X., Wang H., Shi X., Ma X. (2022). Simulation of soil cutting and power consumption optimization of a typical rotary tillage soil blade. Applied Science, 12: 8177. DOI ↗ Google Scholar ↗
- Zhou W., Song C., Sun X., Liu Z., Ni X., Shen K., Wang Y.J., Tian L. (2022). Design of High-Efficiency Soil-Returning Liquid Fertilizer Deep-Application Furrow Openers for Improving Furrowing Performance in Cold Regions of Northeast China. Agriculture, 12: 1286. DOI ↗ Google Scholar ↗