Abstract
Abstract: Customer satisfaction is a central concern in telecommunications, yet empirical evidence from Somalia remains limited. This study examines the relationships between trust, service quality, perceived value, and customer satisfaction in Mogadishu, Somalia. A quantitative, cross-sectional correlational design was used with 77 employees of Hormuud Telecom and Somtel who were also telecommunications service users and responded based on their own service experiences. Data were analyzed using Partial Least Squares Structural Equation Modeling (PLS-SEM) in SmartPLS. Service quality and perceived value were positively and statistically significantly associated with customer satisfaction under two-tailed inference, whereas trust showed a positive but weaker association that did not reach the 5% significance level. Service quality had the largest standardized coefficient, followed by perceived value and trust. Together, the three predictors explained 57.5% of the variance in customer satisfaction. The findings support a multidimensional view of satisfaction involving functional service performance, perceived exchange value, and relational confidence. The study extends customer-satisfaction research to an under-researched telecommunications context in Somalia and offers practical insights for managers.
Keywords
Customer satisfaction Service quality Perceived value Trust Telecommunications Somalia PLS-SEM
1. Introduction
Customer satisfaction is a central concern in service markets because customers evaluate not only the technical outcome of a service but also the overall experience through which that service is delivered. In telecommunications, where customers interact repeatedly with service providers, satisfaction is particularly important for maintaining favorable customer relationships and encouraging continued patronage. Customer satisfaction can be understood as an overall evaluation that develops from customers’ experiences with products or services and reflects the extent to which those experiences meet their expectations (Gustafsson et al., 2005). Prior research has also associated customer satisfaction with favorable behavioral outcomes, including retention, repurchase intentions, and loyalty-related responses. These relationships make understanding the antecedents of customer satisfaction strategically important for telecommunications providers seeking to sustain customer relationships in competitive service environments.
One important antecedent of customer satisfaction is service quality. Service quality concerns customers’ evaluations of how well the services they receive correspond with their needs and expectations. Previous research generally conceptualizes service quality as an assessment of service performance relative to customer expectations and emphasizes that high-quality service can contribute to stronger and more sustainable customer relationships. In telecommunications, this relationship is particularly relevant because the customer experience is shaped by repeated service encounters and perceptions of the provider’s ability to deliver services consistently. Service quality therefore represents the functional or performance-related dimension of the customer-provider relationship and provides an important basis on which customers may form overall judgments of satisfaction.
A second important consideration is trust. Unlike service quality, which primarily reflects customers’ evaluations of service performance, trust captures confidence in the provider’s reliability, integrity, and intentions. Rousseau et al. (1998) conceptualize trust as involving a willingness to accept vulnerability on the basis of positive expectations regarding another party’s intentions or behavior. In service relationships, customers may therefore evaluate a telecommunications provider not only according to what it delivers but also according to whether the organization is perceived as dependable and worthy of confidence. Previous research has linked trust with favorable customer attitudes and longer-term relational outcomes, suggesting that it represents a distinct relational mechanism through which customers evaluate service providers.
Perceived value provides a third and conceptually different perspective on customer satisfaction. Whereas service quality concerns the perceived standard of service and trust concerns confidence in the service provider, perceived value reflects customers’ broader assessment of what they receive relative to what they sacrifice to obtain a service. This assessment incorporates the benefits associated with a service as well as the financial and non-financial costs involved in obtaining it. Perceived value is therefore important because satisfactory service performance does not necessarily mean that customers will regard an offering as worthwhile. Customers may separately evaluate whether the overall exchange represents acceptable value.
Previous studies provide support for examining these three constructs together. Rico et al. (2019), for example, investigated trust, service quality, and perceived value in relation to satisfaction and loyalty using Partial Least Squares Structural Equation Modeling (PLS-SEM) and reported significant relationships between the three predictors and customer satisfaction. Similarly, Uzir et al. (2021) examined service quality, perceived value, trust, and customer satisfaction in a developing-country service context. These studies suggest that customer satisfaction may be better understood by considering several dimensions of customer evaluation simultaneously rather than treating service quality as its sole antecedent. At the same time, much of the existing evidence comes from service contexts such as home delivery, banking, hospitality, and other consumer markets. Such findings cannot automatically be assumed to represent customer evaluations within Somalia’s telecommunications sector.
The present study focuses on Mogadishu, Somalia, as its empirical setting. Although trust, service quality, perceived value, and customer satisfaction have received substantial attention in the broader service literature, clearer empirical evidence is needed regarding how these variables operate together within the Somali telecommunications environment. The study does not assume in advance that telecommunications customers in Mogadishu are dissatisfied. Instead, it investigates the factors associated with their satisfaction. Understanding these relationships is important because findings generated in other industries or national settings may not fully represent the circumstances under which customers evaluate telecommunications providers in Mogadishu.
The contextual gap becomes clearer when prior Somali research is considered. Existing studies have examined service quality, satisfaction, trust, and loyalty in Somalia’s Islamic banking sector. Barre and Warsame (2023), for example, examined service quality and customer satisfaction in Islamic banking, while Barre et al. (2023) investigated service quality, satisfaction, loyalty, and trust among banking customers in Somalia. These studies provide valuable evidence from the Somali service environment, but banking and telecommunications differ in the nature, frequency, and characteristics of customer interactions. Meanwhile, studies that examine trust, service quality, and perceived value together have largely been conducted in other national or sectoral contexts. Consequently, there remains a contextual and integrative need to examine whether these three customer-related constructs are associated with satisfaction within Somalia’s telecommunications setting.
Against this background, the objective of the present study is to examine the relationships between trust, service quality, perceived value, and customer satisfaction in the telecommunications sector in Mogadishu, Somalia. The study addresses the following overarching research question:
To what extent are trust, service quality, and perceived value associated with customer satisfaction in the telecommunications sector in Mogadishu, Somalia?
The study seeks to make three contributions. First, it offers a contextual contribution by extending customer-satisfaction research to Somalia’s telecommunications environment, a setting that has received comparatively limited attention in the literature considered in this study. Second, it provides an empirical contribution by examining trust, service quality, and perceived value simultaneously rather than isolating a single determinant of satisfaction. This integrated perspective recognizes that customers may evaluate telecommunications providers through functional, relational, and value-based considerations at the same time. Third, the study offers a practical contribution by providing telecommunications managers with evidence regarding the different customer-related factors associated with satisfaction. In this way, the study contributes to a more context-sensitive understanding of customer satisfaction in an emerging telecommunications service environment.
2. Literature Review and Hypothesis Development
Building on the research problem established in the introduction, this study conceptualizes customer satisfaction as an overall evaluation that may reflect several aspects of customers’ relationships with telecommunications providers. Rather than assuming that satisfaction arises from service performance alone, the study considers three conceptually distinct predictors: trust, service quality, and perceived value. Together, these constructs capture relational confidence in the provider, evaluations of service performance, and assessments of the benefits obtained relative to the sacrifices associated with the service. Examining these dimensions simultaneously provides a more integrated basis for understanding how customers form satisfaction judgments.
2.1 Customer Satisfaction
Customer satisfaction represents customers’ overall evaluative response to their experience with a product or service. Satisfaction develops through customers’ experiences after acquiring or using a service and reflects the extent to which those experiences correspond with what customers consider acceptable or desirable. Gustafsson et al. (2005) conceptualize satisfaction as an attitude shaped through product or service experience, while related service research treats satisfaction as an overall judgment of performance formed through customer interactions with a provider.
In service environments, satisfaction is important because customers do not necessarily evaluate providers solely on the basis of isolated transactions. Repeated experiences can contribute to broader judgments concerning whether a service provider continues to meet customers’ needs and expectations. Previous research has also associated satisfaction with subsequent behavioral outcomes such as repurchase, favorable recommendations, and customer retention. Kungumapriya and Malarmathi (2018), for example, examined how service quality, perceived value, and trust relate to commitment and loyalty intention in mobile telecommunications, illustrating the broader behavioral relevance of service evaluations.
Although such loyalty-related outcomes demonstrate the broader importance of satisfaction, customer loyalty is not tested as part of the present research model. The dependent construct in this study is customer satisfaction. The focus is therefore on identifying the customer evaluations associated with satisfaction rather than examining subsequent loyalty outcomes.
Customers may form satisfaction judgments through different mechanisms. They may evaluate how well a service performs, whether they have confidence in the provider, and whether the overall exchange provides sufficient value. These mechanisms should not be treated as interchangeable. Service quality concerns customers’ assessments of performance, trust concerns confidence in the provider, and perceived value concerns the balance between benefits and sacrifices. The present study therefore examines each construct as a distinct predictor of overall customer satisfaction.
2.2 Trust and Customer Satisfaction
Trust captures the relational dimension of the customer-provider relationship. It generally reflects customers’ confidence that a service provider will behave reliably, honestly, and in a manner consistent with acceptable expectations. Rousseau et al. (1998) conceptualize trust as involving a willingness to accept vulnerability based on positive expectations about another party’s intentions or behavior. In a service setting, trust may therefore reflect customers’ willingness to depend on a provider because they expect the provider to fulfill commitments and behave in a dependable manner.
Trust is conceptually different from service quality. A customer may believe that a service performs well while still having concerns about the integrity or reliability of the organization providing it. Conversely, customers may maintain confidence in a provider even when an individual service encounter is less than ideal. Trust therefore represents a broader relational judgment rather than simply another measure of service performance.
The importance of trust may become particularly visible in relationships characterized by repeated interactions. Telecommunications customers repeatedly depend on providers for continuing services and therefore form judgments not only about individual service encounters but also about the provider’s broader reliability. When customers perceive a provider as dependable and trustworthy, uncertainty surrounding future interactions may be reduced, contributing to a more favorable evaluation of the overall customer relationship.
Empirical research provides support for a relationship between trust and customer satisfaction. Rico et al. (2019) examined trust alongside service quality and perceived value and reported a positive relationship between trust and satisfaction. Uzir et al. (2021) similarly incorporated trust, service quality, and perceived value into a model of customer satisfaction in a developing-country service environment. The convergence of these findings suggests that relational confidence can contribute to customer satisfaction even when other aspects of the service experience are considered.
Related evidence is also available from the Somali service sector. Barre et al. (2023) examined trust within a model of service quality, customer satisfaction, and loyalty in Islamic banking in Somalia. Although banking differs from telecommunications as a service environment, this work demonstrates the relevance of trust in understanding customer-provider relationships within Somalia. It therefore provides contextual support for investigating whether trust is also associated with satisfaction among telecommunications customers in Mogadishu.
Conceptually, customers who believe that a telecommunications provider is reliable, dependable, and likely to fulfill its commitments should be more likely to evaluate their overall relationship with that provider positively. Based on this reasoning and the prior empirical evidence, the following hypothesis is proposed:
H1: Trust is positively associated with customer satisfaction in the telecommunications sector in Mogadishu, Somalia.
2.3 Service Quality and Customer Satisfaction
Service quality represents customers’ evaluation of the standard and performance of service delivery. It focuses on the degree to which customers believe that the services they receive correspond with their needs and expectations. In this sense, service quality represents the customer’s assessment of service performance rather than the service provider’s internal evaluation of operational performance.
Service quality and customer satisfaction are closely related but conceptually distinct. Service quality concerns the characteristics and performance of a service, whereas customer satisfaction reflects a broader evaluative response to the total service experience. Customers may therefore use perceived service quality as one important input when forming an overall judgment of satisfaction.
This distinction is central to the present research model because service quality is treated as a predictor of satisfaction rather than as an alternative measure of the same construct. The conceptual separation between the variables is also consistent with the wider service literature, where evaluations of service quality are often considered antecedents of overall satisfaction.
Prior studies generally support a positive relationship between service quality and customer satisfaction. Rao and Sahu (2013), for example, examined the relationship between service quality and customer satisfaction in the hotel industry. Rico et al. (2019) similarly incorporated service quality into a broader model alongside trust and perceived value and reported a significant positive relationship with satisfaction. These studies indicate that customers who evaluate service performance positively are more likely to express favorable overall satisfaction judgments.
Research from Somalia provides further contextual support. Barre and Warsame (2023) examined customer service quality and customer satisfaction within Islamic banking in Somalia. Related Somali banking evidence also suggests that several dimensions of service quality, including reliability, sincerity, and tangibility, are positively related to customer satisfaction, although some dimensions may show weaker relationships. This variation is important because it indicates that service-quality relationships may differ according to the specific service characteristics and context being examined.
The telecommunications context therefore warrants direct empirical examination. Customers who believe that telecommunications services meet their expectations and requirements have stronger grounds for forming favorable evaluations of their service experience. Because the present research uses a cross-sectional design, the proposed relationship is expressed in associational rather than causal terms. The following hypothesis is proposed:
H2: Service quality is positively associated with customer satisfaction in the telecommunications sector in Mogadishu, Somalia.
2.4 Perceived Value and Customer Satisfaction
Perceived value captures customers’ assessments of what they obtain from a service relative to what they sacrifice in order to obtain it. It therefore reflects a broader exchange-based evaluation involving service benefits, financial costs, non-financial sacrifices, and the perceived attractiveness of alternatives.
Perceived value is conceptually distinct from service quality. A customer may regard a telecommunications service as technically good while still believing that the overall value obtained from the service is inadequate relative to its cost or other sacrifices. Similarly, a service that is not regarded as exceptional in absolute terms may still provide favorable perceived value if customers consider the benefits to be appropriate relative to what they give up.
This distinction makes perceived value particularly relevant to customer satisfaction. Satisfaction is not necessarily formed only by evaluating whether a service performs effectively. Customers can also consider whether the service is worthwhile. Perceived value therefore captures an exchange-related dimension of the customer experience that complements both service quality and trust.
Previous empirical studies provide support for the relationship between perceived value and customer satisfaction. Rico et al. (2019) examined perceived value together with trust and service quality and reported a positive relationship with customer satisfaction. Uzir et al. (2021) similarly examined perceived value, service quality, and trust as predictors of customer satisfaction in a developing-country service context. These findings support the proposition that value perceptions contribute to customers’ satisfaction judgments in addition to evaluations of service performance and relational confidence.
Perceived value has also been considered across a range of other consumption settings. Jalil et al. (2016), for example, proposed a conceptual model linking perceived value, customer satisfaction, and behavioral intention, while Chinomona et al. (2013) empirically examined perceived value and trust in the context of electronic products. Although these settings differ from telecommunications, they illustrate the broader relevance of perceived value in customer evaluations.
Within telecommunications, customers who perceive that the benefits received from services justify the financial and non-financial sacrifices associated with obtaining those services should be more likely to report favorable overall satisfaction. Perceived value is therefore expected to contribute information that is distinct from both service quality and trust. The following hypothesis is proposed:
H3: Perceived value is positively associated with customer satisfaction in the telecommunications sector in Mogadishu, Somalia.
2.5 Conceptual Framework
The conceptual framework of this study integrates trust, service quality, and perceived value as three distinct predictors of customer satisfaction. Customer satisfaction is treated as the dependent construct, while trust, service quality, and perceived value are treated as the independent predictor constructs.
Trust represents customers’ confidence in the reliability, integrity, and intentions of the telecommunications service provider. Service quality reflects customers’ evaluation of the overall quality and performance of telecommunications service delivery relative to their needs and expectations. Perceived value represents customers’ assessment of the benefits received from telecommunications services relative to the financial and non-financial sacrifices associated with obtaining those services.
Although these three constructs are conceptually different, they provide complementary explanations of customer satisfaction. Trust reflects the relational dimension of the customer-provider relationship, service quality reflects customers’ assessment of service performance, and perceived value reflects customers’ evaluation of the overall exchange. Customer satisfaction represents the broader evaluative judgment formed from customers’ experiences with the telecommunications provider.
Based on the literature reviewed and the hypotheses developed in the preceding sections, the conceptual framework proposes that trust, service quality, and perceived value are each positively associated with customer satisfaction in the telecommunications sector in Mogadishu, Somalia. Figure 1 presents the conceptual framework of the study.
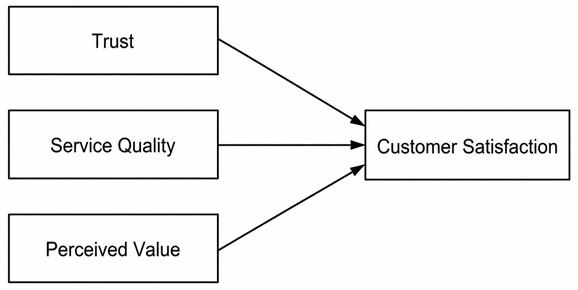
Note. The conceptual framework proposes positive associations between trust, service quality, perceived value, and customer satisfaction in the telecommunications sector in Mogadishu, Somalia.
3. Research Methodology
3.1 Research Design
This study adopted a quantitative, cross-sectional correlational design to examine the relationships between trust, service quality, perceived value, and customer satisfaction in the telecommunications sector in Mogadishu, Somalia. The design allowed the study to assess whether differences in trust, service quality, and perceived value were associated with differences in customer satisfaction without manipulating any of the study variables.
Trust, service quality, and perceived value were treated as predictor constructs, while customer satisfaction was treated as the dependent construct. Given the cross-sectional and non-experimental nature of the study, the relationships are interpreted as statistical associations rather than evidence of causality.
3.2 Study Population and Sampling
The study was conducted among employees of Hormuud Telecom and Somtel in Mogadishu, Somalia. The target population consisted of 350 employees from the two telecommunications companies. The respondents were also users of telecommunications services and completed the questionnaire on the basis of their own service experiences. The sampling frame was organizational, while the study constructs were assessed from respondents’ perspectives as telecommunications service users.
A total of 77 respondents were included in the final analysis. The sample-size target was calculated using the following expression:
n = N / [1 + N(e²)]
where n represents the calculated target sample size, N represents the target population, and e represents the margin of error. With N = 350 and e = 0.10, the calculation is 350 / [1 + 350(0.10²)] = 77.78, which rounds to a target of 78 respondents. The achieved analytic sample was 77 completed responses. Thus, 78 is the calculated target, whereas 77 is the number of responses actually analyzed.
Participants are reported as having been selected through non-probability purposive sampling from the defined organizational population. The methodological basis and remaining documentation constraints for this classification are consolidated in Section 3.6.
3.3 Measurement Instrument
Primary data were collected using a structured, self-administered questionnaire. The instrument consisted of two main sections. The first section collected demographic information, while the second contained items addressing the constructs included in the research model.
Four constructs were measured: trust, service quality, perceived value, and customer satisfaction. Trust was represented by five indicators (TR1–TR5), service quality by five indicators (SQ1–SQ5), perceived value by five indicators (PV1–PV5), and customer satisfaction by six indicators (CS1–CS6). The measurement model therefore contained 21 indicators in total.
The measurement model was evaluated using the statistics generated through PLS-SEM. Indicator reliability was assessed through outer loadings, while internal consistency reliability was examined using Cronbach’s alpha and composite reliability. Convergent validity was assessed using average variance extracted (AVE), and discriminant validity was examined using the heterotrait-monotrait ratio (HTMT).
3.4 Data Collection Procedure
Data were collected directly from respondents using a printed self-administered questionnaire. Participants completed the questionnaire themselves and provided written responses based on their experiences as telecommunications service users. The resulting dataset contained 77 completed responses, which formed the basis of the statistical analysis.
3.5 Data Analysis
The data were analyzed using Partial Least Squares Structural Equation Modeling (PLS-SEM) with SmartPLS. The analysis focused on both the measurement model and the structural relationships specified in the conceptual framework.
The analysis was conducted in two stages. First, the measurement model was assessed to establish the reliability and validity of the four constructs. This involved examining indicator loadings, internal consistency reliability, convergent validity, and discriminant validity. Cronbach’s alpha and composite reliability were used to assess internal consistency, AVE was used to evaluate convergent validity, and HTMT was used to assess discriminant validity.
Second, the structural model was examined to evaluate the relationships between the three predictor constructs and customer satisfaction. The following relationships were tested:
Trust → Customer Satisfaction
Service Quality → Customer Satisfaction
Perceived Value → Customer Satisfaction
The structural assessment included standardized path coefficients, the coefficient of determination (R²), effect sizes (f²), and statistical significance. The inferential convention used for hypothesis testing is documented once in Section 3.6 and applied consistently throughout the article.
Only the direct relationships represented in the conceptual framework were included in the analysis reported in this article.
3.6 Data and Methodological Transparency
This article is based on the available study and project materials. Documentation limitations are consolidated in this section to avoid repetition. The available methodology contains both probability/simple-random and purposive terminology. Because no operational record of random selection is available, the study is conservatively classified as using non-probability purposive sampling. This classification should be interpreted in light of the available documentation.
Regarding the questionnaire and data collection, the construct names, 21 indicator codes, and measurement-model results are available. The complete questionnaire wording, response scale, item-source mapping, fieldwork dates, number of questionnaires distributed, response rate, incomplete-response rules, and any translation, pilot-testing, data-screening, or data-entry procedures are not documented in the materials currently available. These omissions limit the reproducibility of the measurement and data-collection procedures. On 09 August 2026, the Ethics Committee of the Center for Research and Development, SIMAD University, issued Ethics Approval Certificate EC000262 for this study. The certificate states that the committee reviewed the research methodology, participant recruitment strategies, data collection methods, and safeguards for participant confidentiality and data security, and found the research to comply with SIMAD University ethical standards. The certificate also specifies informed consent, confidentiality, data security, and reporting requirements as conditions of approval. The available study materials do not contain a separate participant-information sheet or written consent record. No stronger claim is made about the form in which consent was documented. For statistical inference, the original SmartPLS table reports p-values of .041, .012, and .007 for t-values of 1.741, 2.257, and 2.467, respectively, which are consistent with one-tailed probabilities. Because the original SmartPLS test-type setting and bootstrap distribution/settings are unavailable, this article reports conservative two-tailed p-values recalculated from the reported absolute t-values using the standard-normal approximation (.082, .024, and .014). These values are analytical recalculations rather than verified direct output from a two-tailed SmartPLS run. The inferential results should therefore be interpreted with this qualification. Verification through the original SmartPLS project or raw data would be required to confirm the test type, bootstrap settings, confidence intervals, and structural-model collinearity statistics.
4. Results
4.1 Respondent Profile
The final sample consisted of 77 respondents from Hormuud Telecom and Somtel. The participants were employees of the two telecommunications companies who were also telecommunications service users and completed the questionnaire based on their own service experiences.
| Characteristic | Category | Frequency | Percentage |
|---|---|---|---|
| Gender | Female | 33 | 42.9 |
| Male | 44 | 57.1 | |
| Age | 18–25 years | 59 | 76.6 |
| 26–35 years | 15 | 19.5 | |
| 36–45 years | 3 | 3.9 | |
| Marital status | Married | 9 | 11.7 |
| Single | 68 | 88.3 | |
| Education | Bachelor’s degree | 62 | 80.5 |
| Master’s degree | 5 | 6.5 | |
| Secondary education | 10 | 13.0 | |
| Organizational role | Employee | 60 | 77.9 |
| Manager | 8 | 10.4 | |
| Supervisor | 9 | 11.7 |
The sample was relatively young, with 59 respondents (76.6%) aged between 18 and 25 years. Most respondents held a bachelor’s degree (80.5%). In terms of organizational role, 77.9% were employees, 10.4% were managers, and 11.7% were supervisors.
4.2 Measurement Model Assessment
The measurement model was assessed before examining the structural relationships. The assessment focused on indicator reliability, internal consistency reliability, convergent validity, and discriminant validity.
All indicator loadings exceeded 0.80. Customer satisfaction indicators ranged from 0.870 to 0.910, perceived value indicators from 0.897 to 0.916, service quality indicators from 0.868 to 0.894, and trust indicators from 0.812 to 0.901. These results indicate that the indicators were strongly associated with their respective constructs.
| Construct | Indicators and Loadings | Cronbach’s α | rho_A | Composite Reliability | AVE |
|---|---|---|---|---|---|
| Customer Satisfaction | CS1=.904; CS2=.910; CS3=.902; CS4=.870; CS5=.882; CS6=.877 | .948 | .952 | .959 | .794 |
| Perceived Value | PV1=.916; PV2=.899; PV3=.912; PV4=.897; PV5=.913 | .946 | .950 | .959 | .823 |
| Service Quality | SQ1=.881; SQ2=.883; SQ3=.894; SQ4=.892; SQ5=.868 | .930 | .931 | .947 | .781 |
| Trust | TR1=.812; TR2=.901; TR3=.863; TR4=.874; TR5=.887 | .918 | .932 | .938 | .753 |
The reliability statistics were consistently high across the four constructs. Cronbach’s alpha ranged from 0.918 to 0.948, while composite reliability ranged from 0.938 to 0.959. AVE values ranged from 0.753 to 0.823. These results support internal consistency reliability and convergent validity.
Discriminant validity was assessed using the heterotrait-monotrait ratio (HTMT).
| Construct Pair | HTMT |
|---|---|
| Customer Satisfaction – Perceived Value | .540 |
| Customer Satisfaction – Service Quality | .772 |
| Customer Satisfaction – Trust | .600 |
| Perceived Value – Service Quality | .691 |
| Perceived Value – Trust | .384 |
| Service Quality – Trust | .588 |
All reported HTMT values were below commonly applied thresholds. The highest value was 0.772 between service quality and customer satisfaction, while the lowest was 0.384 between perceived value and trust. These results support discriminant validity among the four constructs.
The original analysis also reported VIF statistics for individual measurement indicators. Because these values relate to the outer measurement model rather than clearly identified structural predictor VIF values, they are not used to draw conclusions about collinearity among trust, service quality, and perceived value in the structural model.
4.3 Structural Model Assessment
The explanatory power of the structural model was assessed using the coefficient of determination. Customer satisfaction had an R² of 0.575 and an adjusted R² of 0.557. Thus, trust, service quality, and perceived value jointly accounted for 57.5% of the variance in customer satisfaction.
The relative contribution of each predictor was also examined using f² effect sizes. Service quality recorded an f² value of 0.116, followed by perceived value at 0.108 and trust at 0.054. Service quality therefore showed the largest reported contribution among the three predictors, although its effect-size value was only slightly higher than that of perceived value.
| Hypothesis | Structural Relationship | f² | β | Sample Mean | SD | t | Two-tailed p |
|---|---|---|---|---|---|---|---|
| H1 | Trust → Customer Satisfaction | .054 | .198 | .208 | .114 | 1.741 | .082 |
| H2 | Service Quality → Customer Satisfaction | .116 | .335 | .333 | .148 | 2.257 | .024 |
| H3 | Perceived Value → Customer Satisfaction | .108 | .294 | .295 | .119 | 2.467 | .014 |
Note. Two-tailed p-values are reported using the conservative recalculation defined in Section 3.6. The underlying SmartPLS test-type setting remains subject to verification.
4.4 Hypothesis Testing
H1 proposed that trust would be positively associated with customer satisfaction. Trust showed a positive standardized path coefficient (β = 0.198, t = 1.741), but the corresponding two-tailed p-value was .082. The direction of the relationship was positive, but H1 was not supported at the conventional 5% two-tailed significance level.
H2 proposed that service quality would be positively associated with customer satisfaction. Service quality showed a positive relationship with customer satisfaction (β = 0.335, t = 2.257, two-tailed p = .024). H2 was supported.
H3 proposed that perceived value would be positively associated with customer satisfaction. The relationship was positive (β = 0.294, t = 2.467, two-tailed p = .014). H3 was supported.
All three standardized path coefficients were positive. In terms of coefficient magnitude, service quality showed the strongest association with customer satisfaction (β = 0.335), followed by perceived value (β = 0.294) and trust (β = 0.198). Under the two-tailed convention used in this article, service quality and perceived value were statistically significant at the 5% level, whereas the positive trust coefficient was not.
The model indicates that service quality and perceived value were positive, statistically supported predictors of customer satisfaction, while trust showed a positive but less certain relationship under two-tailed inference. Together, the three predictors explained 57.5% of the variance in customer satisfaction, and service quality had the largest standardized coefficient.
5. Discussion
5.1 Overview of the Main Findings
All three estimated path coefficients were positive, but inferential support differed. Service quality and perceived value were statistically significant under the two-tailed convention, whereas trust was positive but did not reach the 5% level. The model explained 57.5% of the variance in customer satisfaction, leaving 42.5% outside the model.
Service quality had the largest standardized coefficient (β = 0.335; f² = 0.116), followed closely by perceived value (β = 0.294; f² = 0.108). Trust had a smaller coefficient (β = 0.198; f² = 0.054). The evidence was strongest for functional and value-based evaluations in this sample.
5.2 Trust and Customer Satisfaction
Trust showed a positive but not statistically significant association with customer satisfaction under two-tailed inference (β = 0.198, f² = 0.054, p = .082). H1 was therefore not supported at α = .05. The positive direction is broadly consistent with Rico et al. (2019) and with the inclusion of trust in Uzir et al. (2021), while Barre et al. (2023) show its relevance in Somalia’s banking context.
This result should be treated as inconclusive rather than as evidence that trust is unimportant. Limited statistical power, the specific respondent group, measurement characteristics, or contextual differences are possible explanations for weaker statistical evidence, but these possibilities were not tested in the present study.
5.3 Service Quality and Customer Satisfaction
Service quality was positively and significantly associated with customer satisfaction (β = 0.335, f² = 0.116, p = .024), supporting H2 and showing the strongest standardized relationship in the model. This pattern is consistent with Rico et al. (2019), Rao and Sahu (2013), and Somali banking evidence reported by Barre and Warsame (2023) and Barre et al. (2023).
Within this sample, favorable evaluations of service performance were closely associated with favorable overall satisfaction, although the cross-sectional design does not establish that changes in service quality cause changes in satisfaction.
5.4 Perceived Value and Customer Satisfaction
Perceived value was positively and significantly associated with customer satisfaction (β = 0.294, f² = 0.108, p = .014), supporting H3. The result aligns with Rico et al. (2019) and Uzir et al. (2021) and is consistent with the broader relevance of perceived value discussed by Jalil et al. (2016).
Its coefficient was slightly below that of service quality, indicating that respondents’ evaluations of the benefits-sacrifices balance complemented, rather than replaced, their judgments of service performance.
5.5 Overall Interpretation of the Model
The findings support a multidimensional but unevenly supported account of satisfaction. Service quality represents a functional evaluation, perceived value an exchange-based evaluation, and trust a relational evaluation. The first two received clear statistical support. Trust remained directionally positive but statistically uncertain.
The R² of 0.575 indicates that the predictors jointly accounted for 57.5% of the observed variance in satisfaction. The remaining 42.5% shows that customer satisfaction is broader than the current model and may also relate to factors not measured here.
The study adds evidence from Mogadishu’s telecommunications setting, where the literature reviewed provides comparatively limited direct evidence. However, respondents were employees of Hormuud Telecom and Somtel who were also service users, so the results apply primarily to this group rather than to all telecommunications customers in Mogadishu or Somalia.
6. Theoretical Implications
6.1 Theoretical Contribution of the Integrated Model
The principal theoretical contribution of this study lies in examining trust, service quality, and perceived value simultaneously as distinct predictors of customer satisfaction. Rather than treating satisfaction as a response to a single aspect of the service experience, the study brings together three complementary dimensions through which telecommunications users may evaluate their relationship with a service provider.
Service quality represents the functional dimension of customer evaluation because it concerns perceptions of how well a service performs relative to customer needs and expectations. Perceived value represents a value-based or exchange dimension, reflecting customers’ assessments of the benefits obtained from a service relative to the financial and non-financial sacrifices involved. Trust represents a relational dimension, capturing customers’ confidence in the reliability and dependability of the service provider. These distinctions are consistent with the conceptual treatment of the three constructs developed in Section 2.
The findings support the usefulness of maintaining these dimensions as conceptually separate, while also showing that their empirical support is not identical. Service quality and perceived value were positively and significantly associated with customer satisfaction under two-tailed testing. Trust showed a smaller positive coefficient that did not reach the conventional 5% two-tailed threshold. This pattern supports a multidimensional understanding of customer satisfaction while requiring greater caution in interpreting the relational dimension.
This integrated perspective is broadly consistent with earlier studies such as Rico et al. (2019) and Uzir et al. (2021), which also examined service quality, perceived value, and trust in relation to customer satisfaction. The present study extends this line of inquiry by applying the three-construct framework within Somalia’s telecommunications sector rather than simply reproducing evidence from other service industries or national settings.
The explanatory power of the model further supports the usefulness of this integrated approach. Trust, service quality, and perceived value jointly accounted for 57.5% of the variance in customer satisfaction. Combining functional, value-based, and relational evaluations provides a meaningful account of customer satisfaction within the studied sample. At the same time, the unexplained portion of the variance demonstrates that the model should not be viewed as a complete theoretical explanation of satisfaction.
6.2 Relative Contribution of the Three Predictors
A second theoretical implication concerns the relative contribution of the three predictors. Service quality showed the largest standardized association with customer satisfaction (β = 0.335) and the largest reported f² value (0.116). Perceived value followed relatively closely (β = 0.294; f² = 0.108), while trust showed a smaller positive contribution (β = 0.198; f² = 0.054).
The prominence of service quality suggests that functional evaluations of service performance occupy an important place in customers’ overall satisfaction judgments. Theoretically, this supports the view that satisfaction is strongly connected to whether users believe a service adequately meets their needs and expectations. However, the relatively close contribution of perceived value indicates that satisfaction cannot be understood solely in terms of service performance.
The contribution of perceived value is especially important because it captures a different type of evaluation. Customers may consider a service to be of good quality while still questioning whether the benefits justify the costs or other sacrifices associated with obtaining it. Perceived value therefore extends the explanation of satisfaction beyond performance by incorporating customers’ judgments about the overall worth of the exchange. The literature reviewed in Section 2 similarly conceptualizes perceived value in terms of benefits received relative to costs and alternatives.
Trust adds a further theoretical dimension, but the evidence is more tentative. Although its coefficient was positive, the relationship was not statistically significant at the 5% level under two-tailed testing. Trust therefore remains a conceptually distinct relational dimension whose role should be examined further rather than treated as conclusively established by this sample.
The pattern suggests that customer satisfaction in telecommunications can be considered through functional, value-based, and relational lenses, but the current evidence is strongest for the first two. Service quality and perceived value provide the clearest empirical explanation in the present sample, while trust remains a theoretically relevant but empirically less certain relational component.
6.3 Contextual Contribution to Service and Telecommunications Research
The study also makes a contextual contribution by extending customer-satisfaction research to Somalia’s telecommunications sector. Much of the literature considered in the study originates from other countries and service settings. Rico et al. (2019), for example, examined trust, service quality, and perceived value in a broader customer-satisfaction model, while Uzir et al. (2021) investigated these constructs in a developing-country home-delivery context.
Within Somalia, the research reviewed in Section 2 has focused substantially on financial services. Barre and Warsame (2023) examined service quality and customer satisfaction in Islamic banking, while Barre et al. (2023) considered service quality, satisfaction, loyalty, and trust in the Somali banking environment. Evidence from these studies demonstrates the relevance of customer evaluations within Somalia’s service sector, but banking and telecommunications represent different service environments.
By examining trust, service quality, perceived value, and customer satisfaction together in a telecommunications setting, the present study broadens the contextual application of this research framework. It adds evidence from an under-researched service environment and demonstrates that functional, value-based, and relational evaluations were all associated with satisfaction within the studied sample.
The contribution should nevertheless be interpreted within the boundaries of the research design. The respondents were employees of Hormuud Telecom and Somtel who were also telecommunications service users and completed the questionnaire based on their own service experiences. The findings therefore contribute evidence from this particular group and should not be interpreted as representing all telecommunications customers in Mogadishu or Somalia.
More broadly, telecommunications forms part of the digital and service infrastructure through which individuals and organizations participate in modern economic activity. Consequently, understanding customer evaluations of telecommunications services can provide a foundation for broader research on service-sector and digital-economic development in emerging-market environments. Such connections remain contextual, however. The present study did not directly measure international trade, digital trade, export performance, cross-border services, national competitiveness, or firm performance.
The theoretical contribution of the study lies in integrating functional, value-based, and relational explanations of customer satisfaction and extending their application to Somalia’s telecommunications setting. The findings provide clear support for service quality and perceived value and more tentative evidence for trust, demonstrating the importance of distinguishing conceptual relevance from statistical support in an under-researched service context.
7. Practical/Managerial Implications
7.1 Managerial Importance of Service Quality
Service quality deserves the greatest managerial attention because it showed the largest standardized association with satisfaction (β = 0.335; f² = 0.116). Managers may benefit from systematically monitoring customers’ overall evaluations of service performance and using feedback to identify gaps between expected and experienced quality. The study does not identify specific operational problems such as coverage, billing, or customer support, so recommendations should remain at the construct level.
7.2 Managing Perceived Value
Perceived value was the second strongest predictor (β = 0.294; f² = 0.108). Managers should therefore consider whether customers regard the overall benefits of telecommunications services as worthwhile relative to the sacrifices involved. This does not imply that lower prices necessarily increase satisfaction because price was not tested independently.
7.3 Strengthening Trust and Customer Relationships
Trust showed a smaller positive but statistically nonsignificant relationship (β = 0.198; f² = 0.054). Relational confidence should therefore be treated as a potentially relevant supporting consideration rather than as a conclusively established driver in this dataset. Consistent and credible interactions may help sustain confidence, but trust-focused initiatives should be evaluated with additional customer evidence.
7.4 Integrated Managerial Perspective
Managers should avoid a one-dimensional approach. The evidence supports prioritizing service quality and perceived value while continuing to monitor relational confidence. These implications arise from a specific respondent group and should not be generalized to all telecommunications customers in Somalia.
8. Limitations and Future Research
8.1 Study Limitations
The study has several limitations. The final sample comprised 77 employees of Hormuud Telecom and Somtel who were also telecommunications service users, which restricts generalizability and may limit statistical power. The research was confined to Mogadishu and to respondents associated with two providers, so the findings should not be treated as representative of the wider Somali customer population.
The cross-sectional, non-experimental design identifies associations but cannot establish temporal ordering or causality. Documentation constraints relating to sampling, measurement, participant-consent records, data collection, and SmartPLS settings are consolidated in Section 3.6 and remain relevant to reproducibility and interpretation.
8.2 Directions for Future Research
Future research should use larger and more diverse samples of telecommunications customers, especially customers who are not employees of providers, and extend data collection beyond Mogadishu and across additional companies. Probability-based sampling should be used where a suitable sampling frame and operational procedure are available.
Future studies should preserve complete questionnaire wording, response scales, measurement sources, adaptation or translation procedures, and fieldwork records. Longitudinal or repeated cross-sectional designs could strengthen evidence about temporal patterns, while complete PLS-SEM reporting should include bootstrap settings, confidence intervals, inner-model VIF, and predictive assessments where appropriate.
Additional research may examine other antecedents of satisfaction, including customer experience, accessibility, price perceptions, digital-service use, network reliability, or customer support, provided they are measured with validated instruments. Multi-group analysis may also be useful when sample sizes are sufficient.
Broader questions concerning digital or cross-border economic activity may be explored in future research, but these were not outcomes examined in the present study.
9. Conclusion
9.1 Conclusion
This study examined how trust, service quality, and perceived value were associated with customer satisfaction among 77 employees of Hormuud Telecom and Somtel who were also telecommunications service users in Mogadishu. Service quality showed the strongest positive association (β = 0.335), followed by perceived value (β = 0.294). Both were statistically significant under two-tailed inference. Trust was positive but statistically inconclusive at the 5% level (β = 0.198, p = .082). Together, the three predictors explained 57.5% of the variance in customer satisfaction.
The findings support a multidimensional view of satisfaction in which functional service performance and perceived exchange value received the clearest empirical support, while relational confidence remained theoretically relevant but less certain. The study extends customer-satisfaction evidence to an under-researched Somali telecommunications context without implying causal effects or population-wide generalizability.
Practically, telecommunications managers may benefit from prioritizing service quality and perceived value while continuing to monitor trust as a relational consideration. Future research should test the model with broader customer samples, stronger documentation, and fully verified PLS-SEM settings.
Declarations
Funding: This research received no specific grant from any funding agency in the public, commercial, or not-for-profit sectors.
Conflict of Interest: The author declares no conflict of interest.
Data Availability: The data supporting the findings of this study are available from the corresponding author upon reasonable request.
Ethics Approval: The Ethics Committee of the Center for Research and Development, SIMAD University, approved this study on 09 August 2026 (Ethics Approval Certificate EC000262). The committee reviewed the research methodology, participant recruitment strategies, data collection methods, and safeguards for participant confidentiality and data security. The available study materials do not contain a separate participant-information sheet or written consent record. No stronger claim is made regarding the form in which consent was documented.
Author Contributions: Zakarie Ibrahim Ahmed, as the sole author, was responsible for the conceptualization, methodology, investigation and data collection, analysis, interpretation of the findings, drafting of the manuscript, review and editing, and final approval of the manuscript.
References
- Barre, G. M., & Warsame, A. A. (2023). The impact of customer service quality on customer loyalty through customer satisfaction: A study on the Islamic banks in Somalia. Journal of Tianjin University Science and Technology, 56(8), 209–226. DOI ↗ Google Scholar ↗
- Barre, G. M., Warsame, A. A., Hussein, H. A., & Mohamed, I. I. (2023). Islamic banks’ service quality in Somalia: Customer loyalty, satisfaction, and the role of trust as a mediator. Asian Economic and Financial Review, 13(5), 320–337. DOI ↗ Google Scholar ↗
- Chinomona, R., Okoumba, L., & Pooe, D. (2013). The impact of product quality on perceived value, trust and students’ intention to purchase electronic gadgets. Mediterranean Journal of Social Sciences, 4(14), 463–472. DOI ↗ Google Scholar ↗
- Gustafsson, A., Johnson, M. D., & Roos, I. (2005). The effects of customer satisfaction, relationship commitment dimensions, and triggers on customer retention. Journal of Marketing, 69(4), 210–218. DOI ↗ Google Scholar ↗
- Jalil, N. A. A., Fikry, A., & Zainuddin, A. (2016). The impact of store atmospherics, perceived value, and customer satisfaction on behavioural intention. Procedia Economics and Finance, 37, 538–544. DOI ↗ Google Scholar ↗
- Kungumapriya, A., & Malarmathi, K. (2018). The role of service quality, perceived value and trust on calculative commitment and loyalty intention. Chinese Business Review, 17(6), 287–301. DOI ↗ Google Scholar ↗
- Rao, P. S., & Sahu, P. C. (2013). Impact of service quality on customer satisfaction in hotel industry. IOSR Journal of Humanities and Social Science, 18(5), 39–44. DOI ↗ Google Scholar ↗
- Rico, Tecoalu, M., Wahyoedi, S., & Purnama, E. D. (2019). The effects of trust, service quality and perceived value on satisfaction and their impact on loyalty. In Proceedings of the 7th International Conference on Entrepreneurship and Business Management - ICEBM Untar (pp. 325–330). SciTePress. DOI ↗ Google Scholar ↗
- Rousseau, D. M., Sitkin, S. B., Burt, R. S., & Camerer, C. (1998). Not so different after all: A cross-discipline view of trust. Academy of Management Review, 23(3), 393–404. DOI ↗ Google Scholar ↗
- Uzir, M. U. H., Al Halbusi, H., Thurasamy, R., Thiam Hock, R. L., Aljaberi, M. A., Hasan, N., & Hamid, M. (2021). The effects of service quality, perceived value and trust in home delivery service personnel on customer satisfaction: Evidence from a developing country. Journal of Retailing and Consumer Services, 63, 102721. DOI ↗ Google Scholar ↗