Abstract
We examine the effect of competence, information system quality, and satisfaction on tax compliance in Indonesia. In our study, we apply a quantitative approach using a survey Purposive sampling methoding is used to investigate the association. The final samples 270 taxpayers who uses Coretax. We analyze our data using Covariance-Based Structural Equation Modeling (CB-SEM). The results of our study indicates that taxpayer competence has a positive and significant effect on taxpayer compliance. Next, the result report that satisfaction factor is positively and significantly associated with taxpayer compliance. However, we find that information system quality did not significantly influence taxpayer compliance. We expand the literature on taxpayer compliance in the context of digital tax administration by demonstrating that user competence and experience are key determinants of compliance in the Coretax implementation. The findings provide implications for the Directorate General of Taxes to strengthen tax socialization and digital literacy as part of its strategy to improve taxpayer compliance.
Keywords
Taxpayer Competence System Information Quality User Satisfaction Coretax Taxpayer Compliance
1. Introduction
In recent years, tax authorities in various countries have developed digital technologies to improve administrative processes and enhance the quality of services provided to taxpayers. Digitization enables more efficient, integrated, and data-driven tax processes.
CoretaxDeveloped by the Directorate General of Taxes (DGT) in Indonesia, Coretax is a product of tax administration modernization. Coretax is designed to consolidate the tax process, from taxpayer registration and reporting to payment, monitoring, and data management, all within a single digital platform. Furthermore, to improve administrative efficiency and increase state revenue, this system is a key component of national tax reforms aimed at enhancing taxpayer compliance.
However, the effectiveness of a digital tax system is not limited to technological factors alone. Various studies show that the human element, as the primary user of digital transformation, is also a crucial factor in its success. In the tax sector, taxpayers' ability to understand tax regulations, digital literacy, and access to tax applications are contributing factors to increasing the effectiveness of system utilization. Furthermore, the quality of the information system and user satisfaction during interactions can impact tax compliance.
FromFrom an information systems perspective, system quality is a key factor in determining the success of technology implementation. Users can rely on reliable, secure, and easy-to-navigate digital services. On the other hand, system failures, delayed access attempts, or misinformation can reduce the efficiency of technology utilization and hinder user adoption of the implemented system.
Besides system quality, user satisfactionUser experience is also a crucial factor in evaluating the success of information system technology implementation. Users who have a positive experience with the system are more likely to accept it and demonstrate continued usage behavior. The use of digital taxation can increase trust in the tax system and ensure taxpayers comply with their tax obligations.
Another factor is taxpayer competence. Competence is a person's ability to understand tax regulations, perform tax calculations, and utilize tax technology. Taxpayers with high competence tend to be better able to adapt to changes in the administrative system and are more confident in fulfilling their tax obligations correctly and on time. Therefore, the effectiveness of digital tax administration implementation depends heavily on taxpayer competence.
Various previous studies(Zhou & Zhang, 2024) (Ling, 2025) (Belahouaoui & Attak, 2024)Research shows that the quality of information systems influences tax compliance. Reliable, easy-to-use systems that provide accurate information can reduce reporting errors and strengthen user trust in digital tax administration. Furthermore, user satisfaction has been shown to be a factor that encourages continued system use and supports compliance with tax regulations. On the other hand, taxpayer competence, both in terms of tax knowledge and digital skills, is crucial for ensuring that available technology is optimally utilized. Although most studies find a positive relationship between information system quality and taxpayer compliance, research findings in various digital system implementation contexts indicate that technological factors are not always the primary determinants of compliance behavior. Under certain conditions, user competence and behavioral factors can have a more dominant influence.
Empirical research has identified user competency, information system quality, and user satisfaction as factors that contribute to taxpayer compliance. However, previous studies have focused on partial digital tax services, such as e-filing and e-billing. Research examining Coretax as an integrated tax administration system is still relatively limited in the Indonesian context. Furthermore, studies integrating taxpayer competency, information system quality, and user satisfaction into a single research model are also limited. This situation highlights the need for a more comprehensive understanding of the factors influencing taxpayer compliance in the era of digital tax administration.
BerBased on these conditions, this study aims to analyze the influence of taxpayer competence, information system quality, and satisfaction with Coretax on taxpayer compliance in Indonesia. It is hoped that this research will contribute to the development of digital taxation literature, particularly in the context of Coretax implementation in Indonesia, and provide meaningful input for the Directorate General of Taxes.
This study is relatively new in simultaneously testing the influence of taxpayer competence, information system quality, and user satisfaction on taxpayer compliance in the context of Coretax as an integrated tax administration system implemented in Indonesia. Existing studies have mostly focused on e-filing and e-billing, while research examining Coretax as an integrated tax administration system is still very limited. Furthermore, there are not many studies that simultaneously test the influence of taxpayer competence, information system quality, and user satisfaction on taxpayer compliance in the context of Coretax implementation in Indonesia. Furthermore, this study integrates the perspectives of user behavior and information system success to explain taxpayer compliance in a digital tax administration environment that is more complex than conventional electronic tax services.
2. Institutional Background, Theoretical Framework And Hypothesis Development
2.1 INSTITUTIONAL BACKGROUND
The Directorate General of Taxes (DGT) under the Ministry of Finance in Indonesia is responsible for creating, implementing, and overseeing tax policies in the country. In carrying out its duties, "DGT is supported by 352 Tax Service Offices (KPP) and 204 Tax Service, Counseling, and Consultation Offices (KP2KP) spread throughout Indonesia" (www.pajak.go.id). One of the Ministry of Finance's goals is to achieve a high level of state revenue through excellent service. To support this mission, DGT continues to reform the tax system.
The Core Tax Administration System, known as Coretax, is an integrated tax administration system that connects registration, reporting, payment, and tax oversight processes within a single digital platform. Coretax is expected to improve administrative efficiency, improve tax data quality, and improve service delivery for taxpayers. In practice, the success of this system's implementation depends not only on the technology but also on user competence, perceived system quality, and taxpayer satisfaction levels while using the digital service. Coretax is a relevant system to study through factors influencing taxpayer compliance in the era of digital tax transformation in Indonesia.
2.2 Theoretical Framework2.2.1 Theory of Planned Behavior (TPB)
TPB introduced by(Ajzen, 1991)used to explain why someone is willing or unwilling to perform a particular action. From this perspective, behavior does not emerge spontaneously, but is influenced by an individual's beliefs about the benefits of the action, the influence of the social environment, and the ability to carry out the action.
In the context of digital tax administration, perceived self-efficacy is reflected in taxpayers' competence in understanding tax regulations and operating the digital systems used to fulfill their tax obligations. When taxpayers perceive adequate competence, they tend to be more confident in reporting and paying taxes correctly. Conversely, limited knowledge and technical skills can be barriers that reduce compliance. Therefore, the TPB serves as a relevant theoretical foundation for explaining how taxpayer competence can influence compliance behavior in a digitalized tax environment.
2.2.2 Technology Acceptance Model (TAM)
Explanation(Davis, 1989)This theory explains that technology acceptance is influenced by the perceived ease of use and benefits experienced by users. The existence of technology and user perceptions are part of technology acceptance, which is assessed by the benefits obtained and the level of ease of use. If users perceive real added value, their tendency to accept and use the technology will increase.
In Coretax implementation, perceived ease and usefulness are crucial aspects because the system is used directly by taxpayers to carry out various tax administration activities. If users perceive the system as helpful and without significant difficulties, they are likely to develop a positive attitude toward the system. This positive attitude can develop into user satisfaction, which ultimately encourages continued use. Thus, TAM provides a conceptual basis for understanding the relationship between Coretax user experience and taxpayer compliance behavior.
2.2.3. Information System Success Model (ISSM)
The success of an information system can be measured by the quality of service users receive while interacting with the system. A system that is stable, secure, and capable of presenting relevant information tends to provide a better user experience than a system that frequently experiences technical issues.(DeLone & McLean, 2003).
The quality of the information system in the context of Coretax is a crucial factor because it directly impacts taxpayers' experience in fulfilling their tax obligations digitally. Users will benefit from a system that is stable, accessible, secure, and capable of providing accurate information, helping them fulfill their tax obligations more effectively.
Systems that frequently experience disruptions, respond slowly, or produce unreliable information can lead to decreased user acceptance. Therefore, the ISSM serves as a relevant theoretical framework to explain how information system quality can contribute to compliance through a better user experience for taxpayers.
This study integrates TPB, TAM, and ISSM to explain taxpayer compliance in using Coretax. These three theories complement each other in explaining user behavior in a digital tax administration environment.
The TPB explains that individual behavior is influenced by beliefs about their abilities (perceived behavioral control). This concept is represented in this study by taxpayer competence, which reflects the ability to understand tax provisions and use digital tax systems. The higher the competence, the greater the taxpayer's ability to fulfill their tax obligations.
The ISSM explains that the quality of the system used influences the success of an information system. From this test, the quality of the Coretax information system reflects the extent to which the system is able to provide reliable, secure, easy-to-use services and provide accurate information to support taxpayers' tax activities.
TAM further explained that positive perceptions of technology will result in a positive user experience and increased user satisfaction. This satisfaction can encourage continued system use and strengthen taxpayer compliance behavior.
Thus, ISSM explains the role of system quality, TAM explains the role of user satisfaction, and TPB explains the role of taxpayer competence in shaping compliance behavior. The integration of these three theories provides a comprehensive framework for understanding how technological and individual factors influence taxpayer compliance in using Coretax.
2.3 Hypothesis Development2.3.1 Taxpayer Competence and Taxpayer Compliance
Taxpayer competence is defined as an individual's ability to understand tax regulations, perform tax calculations, and utilize digital tax administration systems. Taxpayers with high competence tend to adapt more easily to system changes and are better able to fulfill their tax obligations accurately. From the TPB perspective, competence is related to an individual's confidence in their ability to carry out an action.
Empirical evidence shows that tax literacy and digital skills contribute to increased taxpayer compliance. The higher the competency, the greater the taxpayer's confidence in reporting and paying taxes correctly and on time. Tax compliance is the voluntary behavior of fulfilling tax obligations in accordance with regulations.(Kirchler, 2005).
Several studies support a positive relationship between taxpayer competence and compliance.(Nookhao & Kiattisin, 2023)shows that understanding the digital tax administration system improves taxpayers' ability to fulfill their tax obligations accurately and consistently.(Saptono et al., 2023)found that tax literacy and the ability to use digital tax services contributed to increased taxpayer compliance intentions and behavior. Similar results were also reported by(Dimitras et al., 2025)said that adequate tax knowledge can reduce reporting errors and strengthen tax compliance. In addition,(Bruns et al., 2025a)found that the level of taxpayer understanding of tax regulations and procedures has a positive influence on compliance behavior in the digital tax environment.
These findings generally indicate that competence is a crucial factor for taxpayers in fulfilling their tax obligations, particularly in technology-based administration systems. The higher the competence, the greater the taxpayer's ability to understand procedures, optimally utilize system features, and avoid administrative errors that can hinder compliance.
Based on these arguments, the following hypothesis is formulated:
H1: Taxpayer competence has a positive effect on taxpayer compliance.
2.3.2 Quality of Information Systems and Taxpayer Compliance
Information system quality is defined as the ability to provide reliable, secure, user-friendly services and produce relevant information. In a digital tax environment, good system quality can reduce administrative barriers, increase user trust, and facilitate the fulfillment of tax obligations.
Several studies have shown that the quality of information systems in e-tax systems contributes significantly to increasing taxpayer trust, satisfaction, and compliance intentions.(Bellon et al., 2022)that digitalization of tax administration supported by a reliable and integrated system can significantly increase tax compliance.(Kusumawardhani et al., 2024)In his research, he showed that the quality of Indonesia's digital tax services has a positive impact on taxpayer compliance by increasing ease of access and service efficiency.(Belahouaoui & Attak, 2024)concluded that a good quality e-tax system can increase user trust and satisfaction, which encourages tax compliance.
Studies show that the quality of information systems does not always have a direct impact on tax compliance.(Nugraha, A., & Yustini, 2024)that the quality of the information system does not have a significant effect on taxpayer compliance.
Thus, it is understandable that a tax system that is easy to use, stable, and capable of providing accurate information will make it easier for taxpayers to fulfill their obligations. The better the quality of the information system perceived by users, the higher the level of taxpayer compliance.
From this statement, the hypothesis that can be formulated is:
H2: The quality of the information system has a positive effect on taxpayer compliance.
2.3.3 The Influence of Coretax User Satisfaction on Taxpayer Compliance
The level of user satisfaction reflects the user's assessment of the experience gained while using a system. In the Technology Acceptance Model (TAM) by(Davis, 1989)Satisfaction is a consequence of users' perceived usefulness and ease of use. Users who have a positive experience tend to have a more favorable attitude toward the system and demonstrate continued usage behavior. In the context of digital taxation, user satisfaction can increase trust in the system and encourage compliance with tax obligations.
Previous research results show that user satisfaction contributes to increasing taxpayer compliance.(Masunga et al., 2021)found that user satisfaction with e-tax services significantly influences tax compliance behavior and acts as a mechanism that strengthens the effectiveness of the digital system.(Saptono et al., 2023)shows that user satisfaction with digital tax systems increases taxpayer compliance intentions while strengthening the relationship between system quality and compliance behavior.(Dimitras et al., 2025)strengthens the finding that satisfaction and trust in the digital tax system are important factors in building voluntary tax compliance.
These findings indicate that user satisfaction is not only related to the user's technical experience but also influences taxpayers' willingness to continue using the system and comply with applicable tax regulations. Therefore, the higher the level of satisfaction with Coretax, the greater the likelihood of taxpayers complying with their tax obligations.
Based on this description, the following hypothesis is formulated:
H3: Satisfaction with using Coretax has a positive effect on taxpayer compliance.
3. Research Methodology
3.1 Research Design
The research design uses a quantitative approach because the main objective of the research is to test the relationship between constructs that have been built based on theoretical foundations and previous research results.
The research model is built based on the Theory of Planned Behavior (TPB)(Ajzen, 1991), Technology Acceptance Model (TAM)(Davis, 1989), and Information System Success Model (ISSM)(DeLone & McLean, 2003). These three theories are used to explain how individual factors, technological factors, and system usage experience contribute to taxpayer compliance behavior in a digital tax administration environment.
3.2 Population and Sample
The study population included individual and corporate taxpayers in Indonesia who have used the Coretax system. The unit of analysis in this study was individuals or representatives of business entities who have experience using Coretax to fulfill their tax obligations.
Because not all taxpayers have used Coretax, the study employed a non-probability sampling technique with a purposive sampling approach. This method allows researchers to select respondents who meet specific criteria and thus provide information relevant to the research objectives.The respondent criteria used were being registered as a taxpayer and having used Coretax for tax activities.
The number of samples taken was 270 respondents who met the recommendations.Hair et al. (2019)AndKline ((2015) which suggests a minimum of 200 respondents for covariance-based Structural Equation Modeling (CB-SEM) analysis.
3.3 Types and Sources of Data
The research uses primary data through online questionnaire distribution. The research instrument was designed using a Likert scale because it can measure respondents' perceptions, attitudes, and experiences regarding the effective use of the Coretax system. A five-point response range was determined:
1 = Strongly Disagree, 2 = Disagree, 3 = Neutral, 4 = Agree, 5 = Strongly Agree
3.4 Research Model and Operational Definition of Variables
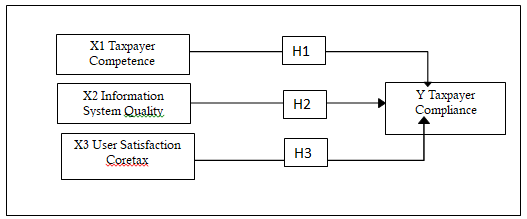
The research model describes the relationship between the Independent Variables (X₁, X2 and X3) isTaxpayer Competence,Coretax Information System Quality, User Satisfaction and the Dependent Variable (Y) is Taxpayer Compliance.
The research instrument was developed based on adaptations of indicators used and validated in previous research on digital tax administration, taxpayer compliance, and information system success. Adaptations were made to the context of Coretax implementation without altering the conceptual meaning of each construct.Conceptually, this model is based on Taxpayer Competence, Information System Quality and Satisfaction with the Use of the Coretax system which will ultimately increase the level of compliance (Figure 1).
The research instrument was adapted from(Saptono et al., 2023), and research related to digital tax administration. All items were adapted to the Coretax context without changing the meaning of the constructs being measured.
Operational Definition of Variables:
Taxpayer Competence (X1)
Taxpayer competence is defined as an individual's ability to understand tax provisions, carry out tax administration, and effectively use digital tax systems. This construct is measured through indicators of tax knowledge, administrative skills, digital literacy, understanding of rights and obligations, and the ability to adapt to regulatory changes.
Information System Quality (X2)
Information system quality is user perception of Coretax's ability to provide reliable, secure, easy-to-use services and produce relevant information. This variable is measured using indicators such as system quality, information quality, ease of use, service reliability, and technical support.
Satisfaction with Using Coretax (X3)
Coretax user satisfaction is the level of positive user evaluation of the experience gained while using the system. This construct is measured through perceptions of information accuracy, information reliability, and the system's suitability to user needs.
Taxpayer Compliance (Y)
Tax compliance is the behavior of taxpayers in fulfilling their tax obligations in accordance with applicable regulations. This variable is measured through indicators of timeliness of reporting, payment compliance, accuracy of reporting, and tax awareness.
3.5 Data Collection Techniques
The research data is primary data obtained through a survey using an electronic questionnaire. The questionnaire was distributed online to reach respondents from various regions in Indonesia who have used Coretax.
Prior to widespread distribution, the research instrument underwent a limited pilot test to ensure the clarity of the questions and the appropriateness of the indicators to the constructs being measured. The pilot test results were used to refine the wording of the questions before the main data collection process.
3.6 Data Analysis Techniques
Researchers used the Covariance-Based Structural Equation Modeling (CB-SEM) approach with the LISREL tool to process the data analysis. CB-SEM is appropriate for research that aims to test a model involving several latent constructs and causal relationships between variables that have been developed based on TPB, TAM, and ISSM, as recommended by(Hair et al., 2019)And(Kline, 2015).
The analysis was carried out in three stages, namely:
-
descriptive analysis,
Descriptive analysis was conducted to determine the characteristics of respondents and the tendency of answers to each research variable through the average value and standard deviation.
-
measurement model testing (Confirmatory Factor Analysis)
Evaluation of the measurement model was carried out using Confirmatory Factor Analysis (CFA) to test the validity and reliability of the construct.
The quality of the measurement model is evaluated through the ability of the indicators to represent the latent construct being measured. The evaluation is conducted using loading factor values, AVE, and composite reliability according to criteria recommended in the SEM literature.
-
structural model testing
A structural model was used to test the relationships between latent variables according to the research hypotheses. Model feasibility was evaluated using several goodness-of-fit measures, such as RMSEA, CFI, TLI/NNFI, NFI, and RMR, as recommended by Hair et al. (2019).
-
Hypothesis testing
Hypothesis testing uses the t-value and path coefficient. The hypothesis is stated as supported if the t-value is greater than 1.96 at a 5% significance level and the direction of the relationship is in accordance with the proposed hypothesis.
| Alternative Answers | Positive statement score |
| 2Chi Square | Expected Small |
| Probability | ≥ 0.05 |
| CMIN/DF | ≤ 2.00 |
| RMSEA | ≤ 0.08 |
| GFI | ≥ 0.90 |
| AGFI | ≥ 0.90 |
| TLI | ≥ 0.95 |
| CFI | ≥ 0.95 |
4. Research Results And Discussion
4.1 General Description of Research Object
Data was collected from taxpayers registered with the Indonesian Directorate General of Taxes according to certain criteria. Data collection involved 270 respondents.
4.2 Respondent Characteristics
| Profile | Category | Frequency | % |
| Gender | Man | 145 | 53.7% |
| Woman | 125 | 46.3% | |
| Age | 18 – 24 years old | 25 | 9.3% |
| 25 – 35 years old | 56 | 20.7% | |
| 36 – 45 years old | 59 | 21.9% | |
| 46 – 55 years old | 97 | 35.9% | |
| Over 55 years old | 33 | 12.2% | |
| Education | SENIOR HIGH SCHOOL | 3 | 1.1% |
| D1 | 1 | 0.4% | |
| D3 | 57 | 21.1% | |
| D4/S1 | 179 | 66.3% | |
| S2 | 20 | 7.4% | |
| Registered as a Taxpayer | Individual | 181 | 67.0% |
| Body | 89 | 33.0% |
The majority of respondents in this study were registered as individual taxpayers (67%), and the majority were male (53.3%), with the majority aged between 25 and 55 years (78.5%). The majority of respondents were D4/S1 graduates (66.3%).
4.3 Descriptive Analysis of Variables
Descriptive analysis(Cooper& Schindler, 2014), using the mean value (a measure of central symptoms) and standard deviation (a measure of variability) to describe the condition of each variable.
-
Taxpayer Competence
Taxpayer competency consists of six indicators and is operationalized into 20 questionnaire items. The following are descriptive statistics of the scoring results of respondents' responses to taxpayer competency, measured using a Likert scale with five answer options.
Descriptive statistics of taxpayer competencies
| No. | Latent Construct | Mean | Std. Dev. | Validity Reliability* |
|---|---|---|---|---|
| Taxpayer Competence | 3.66 | 0.97 | 0.941 | |
| 1 | I understand the general tax provisions currently in force in Indonesia. | 3.71 | 0.67 | 0.724 |
| 2 | I know the types of taxes I have to pay. | 3.93 | 0.68 | 0.753 |
| 3 | I am aware of the legal consequences of not paying taxes. | 4.09 | 0.68 | 0.589 |
| 4 | I can calculate the tax payable correctly according to the provisions | 3.93 | 0.68 | 0.744 |
| 5 | I understand the difference between final and non-final taxes. | 3.98 | 0.73 | 0.706 |
| 6 | I am able to fill out the SPT correctly without any help from other parties. | 3.54 | 0.98 | 0.650 |
| 7 | I always keep proof of payment and tax reporting neatly. | 4.23 | 0.76 | 0.489 |
| 8 | I can use the Coretax application without any problems. | 2.87 | 1.09 | 0.515 |
| 9 | I understand how to report taxes through the Coretax system. | 3.35 | 1.00 | 0.766 |
| 10 | I can solve common errors when using digital tax applications. | 2.78 | 1.14 | 0.604 |
| 11 | I was able to overcome simple technical issues while using Coretax. | 2.87 | 1.14 | 0.664 |
| 12 | I have enough digital literacy to do tax reporting online. | 3.40 | 0.90 | 0.701 |
| 13 | I am able to operate the Coretax application without the help of others. | 3.16 | 1.06 | 0.669 |
| 14 | I know my rights as a taxpayer, such as reductions or objections | 3.59 | 0.82 | 0.605 |
| 15 | I am aware of my obligation to report taxes on time. | 4.21 | 0.76 | 0.503 |
| 16 | I understand the tax payment and reporting deadlines. | 4.22 | 0.70 | 0.578 |
| 17 | I understand the sanctions that will be received if I do not comply with taxes. | 4.15 | 0.74 | 0.620 |
| 18 | I follow the latest information regarding changes in tax regulations. | 3.77 | 0.78 | 0.773 |
| 19 | I am able to adapt to changes in the digital tax system. | 3.61 | 0.83 | 0.779 |
| 20 | I understand the impact of changes in tax regulations on my obligations. | 3.76 | 0.78 | 0.763 |
*Reliability is measured by Cronbach's alpha for the construct and validity is measured by corrected item-total correlation for the questionnaire items
The taxpayer competency variable obtained a mean score of 3.66 (closer to a score of 4), indicating that taxpayer competency in Indonesia is good. The reliability coefficient (0.941) is greater than 0.7, indicating that the statement items are consistent in measuring the taxpayer competency variable. Among the 20 statement items on the taxpayer competency variable, "taxpayers' understanding of tax payment and reporting deadlines" has the highest mean score, namely 4.22. On the other hand, "taxpayers' ability to overcome errors when using digital tax applications” has the lowest mean score, namely 2.78.
-
Information System Quality
Information system quality consists of five indicators and is operationalized into 13 statements. The following are descriptive statistics of the data resulting from scoring respondents' responses to information system quality, measured using a Likert scale with five answer choices.
. Table 4. Descriptive statistics of information system quality
| No. | Latent Construct | Mean | Std. Dev. | Validity Reliability* |
|---|---|---|---|---|
| Information system quality | 2.70 | 1.04 | 0.937 | |
| 1 | I feel comfortable with the process of submitting SPT through the Coretax system. | 3.19 | 0.99 | 0.659 |
| 2 | The Coretax system works stably when I use it. | 2.36 | 0.98 | 0.584 |
| 3 | Coretax rarely experiences disruptions during the tax reporting process. | 2.15 | 0.98 | 0.662 |
| 4 | Coretax responds quickly to every command | 2.39 | 0.92 | 0.798 |
| 5 | The process of uploading or sending data in Coretax takes a short time. | 2.53 | 1.01 | 0.792 |
| 6 | Coretax is easy to learn even for first time users. | 2.76 | 1.00 | 0.740 |
| 7 | Menus and features in Coretax are easy to find and use. | 2.99 | 0.97 | 0.735 |
| 8 | Coretax's interface is easy to understand. | 2.98 | 0.95 | 0.746 |
| 9 | Navigation in Coretax helps me complete tax reporting more easily. | 3.05 | 0.97 | 0.749 |
| 10 | I feel that my personal data and tax data are safe in Coretax. | 3.10 | 0.85 | 0.679 |
| 11 | Coretax security features make me confident to use this system | 3.13 | 0.83 | 0.678 |
| 12 | Coretax rarely experiences errors when I input data | 2.20 | 1.07 | 0.656 |
| 13 | Technical errors do not interfere with my tax reporting process at Coretax | 2.26 | 1.06 | 0.709 |
*Reliability is measured by Cronbach's alpha for the construct and validity is measured by corrected item-total correlation for the questionnaire items
The results of respondents' responses to the questionnaire regarding the information system quality variable obtained a mean score of 2.70 (approaching a score of 3), indicating that the quality of the tax information system in Indonesia is still quite good according to taxpayers. The reliability coefficient (0.937) is greater than 0.7, indicating that the statement items have consistency in measuring the information system quality variable. Among the 13 statement items for the information system quality variable, "feeling comfortable with the process of submitting SPT through the Coretax system" has the highest mean score, namely 3.19. In contrast, "The Coretax system rarely experiences disruptions during the tax reporting process.” has the lowest mean score, namely 2.15.
-
Coretax System User Satisfaction
Satisfaction with the Coretax system consists of four indicators and is operationalized into four statements. The following are descriptive statistics of the data from the scoring of respondents' responses regarding satisfaction with the Coretax system, measured using a Likert scale with five answer choices.
. Table 4.4 Descriptive statistics on satisfaction with the use of the Coretax system
| No. | Latent Construct | Mean | Std. Dev. | Validity Reliability* |
|---|---|---|---|---|
| Coretax System User Satisfaction | 2.55 | 0.99 | 0.847 | |
| 1 | The process of reporting SPT through Coretax rarely experiences disruptions. | 2.01 | 0.87 | 0.726 |
| 2 | I feel satisfied in reporting SPT through Coretax. | 2.54 | 0.99 | 0.749 |
| 3 | The current Coretax system meets my expectations. | 2.44 | 0.86 | 0.697 |
| 4 | The Coretax system helps with my tax needs. | 3.20 | 0.87 | 0.580 |
*Reliability is measured by Cronbach's alpha for the construct and validity is measured by corrected item-total correlation for the questionnaire items
The results of respondents' responses to the questionnaire regarding the satisfaction variable for using the Coretax system obtained a mean score of 2.55 (approaching a score of 3), indicating that satisfaction with using the Coretax system in Indonesia is quite satisfactory. The reliability coefficient (0.847) is greater than 0.7, indicating that the statement itemsThe questionnaire consistently measures the satisfaction variable for using the Coretax system. Among the four items, the satisfaction variable for using the Coretax system, "the Coretax system helps with tax needs," has the highest mean score, at 3.20. In contrast, "The process of reporting SPT through Coretax rarely experiences disruptions” has the lowest mean score, namely 2.01.
-
Taxpayer Compliance
Taxpayer compliance consists of four indicators and is operationalized into seven statements. The following are descriptive statistics of the data resulting from scoring respondents' responses to taxpayer compliance, measured using a Likert scale with five answer choices.
| No. | Latent Construct | Mean | Std. Dev. | Validity Reliability* |
|---|---|---|---|---|
| Taxpayer Compliance | 4.21 | 0.77 | 0.938 | |
| 1 | I reported all tax debts in the Tax Return (SPT) submitted through Coretax | 4.17 | 0.86 | 0.789 |
| 2 | I report all income in the SPT submitted through Coretax | 4.21 | 0.83 | 0.811 |
| 3 | I always submit my SPT on time, both via e-filing and via Coretax. | 4.20 | 0.81 | 0.878 |
| 4 | I reported my tax return before the due date. | 4.28 | 0.72 | 0.827 |
| 5 | I paid my tax debt before the due date for reporting my SPT. | 4.29 | 0.69 | 0.844 |
| 6 | I prioritize paying tax debts before other bills. | 3.99 | 0.78 | 0.642 |
| 7 | I will pay my taxes correctly. | 4.36 | 0.64 | 0.839 |
*Reliability is measured by Cronbach's alpha for the construct and validity is measured by corrected item-total correlation for the questionnaire items
The results of respondents' responses to the taxpayer compliance questionnaire obtained a mean score of 4.21 (still closer to a score of 4), indicating that taxpayer compliance is high. The reliability coefficient (0.938) is greater than 0.7, indicating that the statement items are consistent in measuring taxpayer compliance. Among the 7 statement items on the taxpayer compliance variable, "pay taxes correctly" has the highest mean score, which is 4.36. On the other hand, "prioritize paying tax debts before other bills” has the lowest mean score, namely 3.99.
4.4 Structural Equation Modelling
In accordance with the research objective, which was to examine the influence of taxpayer competence, information system quality, and satisfaction with the Coretax system on taxpayer compliance, the data was processed using covariance-based structural equation modeling (CB-SEM). In evaluating the measurement model, an indicator is considered valid if it has a factor weight (loading factor) greater than 0.5.(Hair et al., 2019). Still according to(Hair et al., 2019) The construct reliability (CR) that is considered satisfactory is greater than 0.70 and the average variance extracted (AVE) is expected to be greater than 0.50.
-
Taxpayer Competency Measurement Model
Taxpayer competency consists of 6 indicators and based on processing using Lisrel 8.7, the results of the evaluation model for measuring taxpayer competency variables are obtained as presented in the following table.
| Indicator | Symbol | Mean | 2 | CR | AVE | |
|---|---|---|---|---|---|---|
| Tax knowledge | X1.1 | 3.91 | 0.913 | 0.834 | 0.926 | 0.679 |
| Ability to calculate taxes | X1.2 | 3.93 | 0.858 | 0.736 | ||
| Administrative skills | X1.3 | 3.91 | 0.886 | 0.785 | ||
| Tax technology capabilities | X1.4 | 3.07 | 0.639 | 0.408 | ||
| Understanding rights and obligations | X1.5 | 3.90 | 0.716 | 0.513 | ||
| Regulatory adaptation | X1.6 | 3.90 | 0.894 | 0.799 |
In table 4.6 you can see the loading factor () of each indicator is greater than 0.5 and is acceptable. Then the CR value of 0.926 is greater than 0.70 indicating that these indicators have consistency in measuring taxpayer competency variables. The AVE value of 0.679 indicates that on average 67.9% of the information contained in each indicator can be reflected through taxpayer competency variables. Indicator X1.1 (tax knowledge) is the strongest in reflecting taxpayer competency variables with a mean score of 3.91 (good). Conversely, indicator X1.4 (tax technology capability) is the weakest in reflecting taxpayer competency variables with a mean score of 3.07 (fairly good).
-
Information System Quality Measurement Model
The quality of the information system consists of 7 indicators and based on processing using Lisrel 8.7, the results of the evaluation model for measuring the quality of the information system variables are obtained as presented in the following table.
| Indicator | Symbol | Mean | 2 | CR | AVE | |
|---|---|---|---|---|---|---|
| System quality | X2.1 | 2.77 | 0.763 | 0.582 | 0.921 | 0.628 |
| System speed | X2.2 | 2.27 | 0.916 | 0.839 | ||
| Ease of use | X2.3 | 2.76 | 0.929 | 0.863 | ||
| System security | X2.4 | 3.16 | 0.729 | 0.531 | ||
| System availability | X2.5 | 2.26 | 0.707 | 0.500 | ||
| User interface & navigation | X2.6 | 3.05 | 0.767 | 0.588 | ||
| Minimal errors/bugs | X2.7 | 2.20 | 0.703 | 0.494 |
In table 4.7 you can see the loading factor () of each indicator is greater than 0.5 and is acceptable. Then the CR value of 0.921 is greater than 0.70 indicating that these indicators have consistency in measuring the information system quality variable. The AVE value of 0.628 indicates that on average 62.8% of the information contained in each indicator can be reflected through the information system quality variable. Indicator X2.3 (ease of use) is the strongest in reflecting the information system quality variable with a mean score of 2.76 (quite good). Conversely, indicator X2.7 (minimal error) is the weakest in reflecting the information system quality variable with a mean score of 2.20 (less good).
Coretax System User Satisfaction Measurement Model
Satisfaction with the use of the Coretax system consists of 4 indicators and based on processing using Lisrel 8.7, the results of the evaluation model for measuring the satisfaction variable for the use of the Coretax system are obtained as presented in the following table.
| Indicator | Symbol | Mean | 2 | CR | AVE | |
|---|---|---|---|---|---|---|
| Overall satisfaction | X3.1 | 2.01 | 0.836 | 0.699 | 0.844 | 0.577 |
| Conformity to expectations | X3.2 | 2.54 | 0.795 | 0.632 | ||
| Perception of benefits | X3.3 | 2.44 | 0.727 | 0.529 | ||
| User experience | X3.4 | 3.20 | 0.671 | 0.450 |
In table 4.8 you can see the loading factor () of each indicator is greater than 0.5 and is acceptable. Then the CR value of 0.844 is greater than 0.70 indicating that these indicators have consistency in measuring the variable of satisfaction in using the Coretax system. The AVE value of 0.577 indicates that on average 57.7% of the information contained in each indicator can be reflected through the variable of satisfaction in using the Coretax system. Indicator X3.1 (overall satisfaction in using the system) is the strongest in reflecting the variable of satisfaction in using the Coretax system with a mean score of 2.01 (less satisfied). Conversely, indicator X3.4 (experience in using the system) is the weakest in reflecting the variable of satisfaction in using the Coretax system with a mean score of 3.20 (quite satisfied).
-
Taxpayer Compliance Measurement Model
Taxpayer compliance consists of 4 indicators and based on processing using Lisrel 8.7, the results of the evaluation model for measuring taxpayer compliance variables are obtained as presented in the following table.
| Indicator | Symbol | Mean | 2 | CR | AVE | |
|---|---|---|---|---|---|---|
| Timeliness of reporting | Y.1 | 4.22 | 0.882 | 0.778 | 0.926 | 0.758 |
| Payment compliance | Y.2 | 4.29 | 0.917 | 0.841 | ||
| Correctness of tax calculations | Y.3 | 4.36 | 0.897 | 0.805 | ||
| Tax awareness | Y.4 | 3.99 | 0.780 | 0.608 |
In table 4.9 you can see the loading factor () of each indicator is greater than 0.5 and is acceptable. Then the CR value of 0.926 is greater than 0.70 indicating that these indicators have consistency in measuring taxpayer compliance variables. The AVE value of 0.758 indicates that on average 75.8% of the information contained in each indicator can be reflected through the taxpayer competency variable. Indicator Y.2 (payment compliance) is the strongest in reflecting the taxpayer competency variable with a mean score of 4.29 (compliant). Conversely, indicator Y.4 (tax awareness) is the weakest in reflecting the taxpayer compliance variable with a mean score of 3.99 (high).
Visually, the path diagram of the influence of taxpayer competence, information system quality, and satisfaction with the use of the Coretax system on taxpayer compliance can be seen in the following figure.
Figure 1 SEM Model Path Diagram of Research Results
4.5 Goodness of Fit Test
Goodness of fit test(Hair et al., 2019)in structural equation modeling can be seen in the following table.
| Goodness of Fit Measure | It is expected | Results |
|---|---|---|
| Chi-Square | p > 0.05 | p = 0.000 |
| Chi-Square/df | < 2 | 2.66 |
| Goodness of Fit Index (GFI) | ≥ 0.9 | 0.850 |
| Root Mean Square Error of Approximation (RMSEA) | < 0.08 | 0.078 |
| Root Mean Residual (RMR) | < 0.08 | 0.066 |
| Non-Normed Fit Index (NNFI/TLI) | > 0.9 | 0.952 |
| Normed Fit Index (NFI) | > 0.9 | 0.941 |
| Relative Fit Index (RFI) | > 0.9 | 0.925 |
| Incremental Fit Index (IFI) | > 0.9 | 0.962 |
| Comparative Fit Index (CFI) | > 0.9 | 0.962 |
4.6 Structural Model
The following is a summary of the values used in testing the structural model to test the influence of the independent latent variable (exogenous latent variable) on the dependent latent variable (endogenous latent variable).
| Path | Coefficient | t-statistic | p-value | R2 | Decision |
|---|---|---|---|---|---|
| X1 => Y | 0.493 | 8,552 | 0.000 | 0.313 | Significant |
| X2 => Y | 0.017 | 0.318 | 0.750 | Not Significant | |
| X3 => Y | 0.188 | 3.175 | 0.001 | Significant |
The R-square value shows that taxpayer competence, information system quality, and satisfaction with the Coretax system have a 31.3% influence on taxpayer compliance. Based on the path coefficient value, taxpayer competence (X1) is very dominant in influencing taxpayer compliance in Indonesia.
4.7 Hypothesis Testing
In order to prove whether taxpayer competence, information system quality, and satisfaction with the use of the Coretax system have an effect on taxpayer compliance, a hypothesis test was conducted.
-
The Influence of Taxpayer Competence on Taxpayer Compliance
The first hypothesis to be tested is the influence of taxpayer competence (X1) on taxpayer compliance (Y) with the following statistical hypothesis.
H0:1.1= 0Taxpayer competence does not affect taxpayer compliance
HA:1.1≠ 0Taxpayer competence influences taxpayer compliance
-
The Influence of Information System Quality on Taxpayer Compliance
The second hypothesis to be tested is the influence of information system quality (X2) on taxpayer compliance (Y) with the following statistical hypothesis.
H0:1.2= 0The quality of the information system does not affect taxpayer compliance.
HA:1.2≠ 0The quality of the information system influences taxpayer compliance
-
The Influence of Satisfaction with the Use of the Coretax System on Taxpayer Compliance
The third hypothesis to be tested is the effect of satisfaction with the use of the coretax system (X3) on taxpayer compliance (Y) with the following statistical hypothesis.
H0:1.3= 0Satisfaction with the use of the Coretax system does not affect taxpayer compliance.
HA:1.3≠ 0Satisfaction with the use of the Coretax system has an impact on taxpayer compliance.
| Ranking | Variables | Path Coefficient (β) | Significance |
|---|---|---|---|
| 1 | Taxpayer Competence | 0.493 | Significant |
| 2 | Coretax User Satisfaction | 0.188 | Significant |
| 3 | Information System Quality | 0.017 | Not Significant |
The results of the structural model test confirm that taxpayer competence is the variable with the greatest influence on taxpayer compliance, with a path coefficient of 0.493. This means that taxpayers' ability to understand tax provisions, manage tax administration, and utilize digital tax technology are the main factors driving compliance behavior.
Satisfaction with Coretax users ranked second with a path coefficient of 0.188 and a significant influence on taxpayer compliance. These results indicate that a positive user experience can increase taxpayers' likelihood of fulfilling their tax obligations.
Meanwhile, information system quality has a path coefficient of 0.017 and does not significantly influence taxpayer compliance. This empirical finding indicates that in the early stages of Coretax implementation, user competence and experience play a more dominant role than perceptions of the system's quality. Top of Form
Bottom of Form
4.8 Discussion
The Influence of Taxpayer Competence on Taxpayer Compliance
The test results show that taxpayer competence has a positive and significant impact on taxpayer compliance. This finding suggests that the greater a taxpayer's ability to understand tax provisions, utilize digital tax systems, and understand tax rights and obligations, the higher the level of taxpayer compliance.
Based on the results of the structural analysis, taxpayer competence is the variable with the greatest influence on compliance compared to other variables. This condition indicates that the success of Coretax implementation is determined not only by the quality of the technology, but also by the user's readiness to utilize the available system.
These findings support the Theory of Planned Behavior(Ajzen, 1991b), particularly the concept of perceived behavioral control, which is an individual's belief in their ability to perform a behavior. Tax competence improves taxpayers' ability to fulfill their tax obligations correctly and on time through the Coretax digital system.
This finding also supports the research results(Dimitras et al., 2025) (Nookhao & Kiattisin, 2023) (Bruns et al., 2025a)which shows that tax understanding and digital capabilities have a positive influence on tax compliance.
This phenomenon is understandable because using Coretax requires taxpayers to independently perform various administrative processes. Taxpayers with strong tax knowledge and digital skills tend to understand reporting procedures more easily, reduce administrative errors, and are better able to adapt to system changes that occur during implementation.
Practically, this study's findings demonstrate that improving taxpayer compliance through technology development alone is not sufficient. Tax education programs, Coretax training, and increased digital literacy need to be part of a tax administration reform strategy.
The Influence of Information System Quality on Taxpayer Compliance
The research results show that information system quality does not significantly influence taxpayer compliance. The quality of the Coretax system, whether in terms of ease of use, data security, system stability, or the quality of the information produced, does not affect taxpayer compliance levels. This finding indicates that taxpayer perceptions of the quality of the Coretax system are not yet a determining factor in tax compliance behavior.
The results of this study are interesting because they deviate from the basic assumptions of the ISSM, which states that good system quality will increase system usage, user satisfaction, and ultimately generate organizational and individual benefits. However, in the context of this study, information system quality does not directly impact taxpayer compliance. The existence of a quality system does not necessarily change compliance behavior if users remain motivated or obligated to fulfill their tax obligations regardless of the system used.
The descriptive findings of the study also support this explanation. Although the information system quality received an average score of only 2.70, indicating a fairly good assessment, the level of taxpayer compliance was in the high category with an average score of 4.21. Furthermore, several system quality indicators received low ratings, particularly for aspects of system stability, minimal disruptions, and application error rates. The indicator "Coretax rarely experiences disruptions during the tax reporting process" received the lowest average score of 2.15. This condition indicates that respondents are aware of the system's limitations but still comply with their tax obligations.
Empirical findings(Bruns et al., 2025a) shows that tax competence and understanding have a stronger influence on compliance than the quality of technology used in the tax administration process.(Nugraha, A., & Yustini, 2024)found that information system quality had no significant effect on taxpayer compliance. These results indicate that technology quality was not a primary factor determining compliance behavior in the early stages of Coretax implementation. This finding aligns with the Theory of Planned Behavior, which emphasizes the importance of internal individual factors in shaping behavior.(Timothy, J., & Abbas, 2021)shows that tax knowledge, tax morale, and trust in public authorities have a positive relationship with tax compliance. In addition,(Rusli et al., 2024)also showed that the quality of tax services had no effect on taxpayer compliance. Thus, the results of this study strengthen the argument that in the early stages of implementing a digital tax system, user competency and characteristics play a more dominant role than the quality of the information system in shaping taxpayer compliance.
Thus, the results of this study indicate that in the early stages of Coretax implementation, human factors were still more dominant than technological factors in shaping taxpayer compliance behavior. The quality of information systems remains crucial to support service convenience and efficiency, but improving system quality alone is insufficient to increase compliance without improving user competence and tax awareness.
The Influence of Satisfaction with the Use of the Coretax System on Taxpayer Compliance
Test results indicate that satisfaction with the Coretax system has a positive and significant impact on taxpayer compliance. The higher the level of taxpayer satisfaction with the Coretax system, the greater the taxpayer's tendency to voluntarily fulfill their tax obligations.
These results support the Technology Acceptance Model (TAM)(Davis, 1989)which explains that perceived ease of use and system benefits will shape users' positive attitudes toward the system. When taxpayers are satisfied with the Coretax system, they will be more likely to accept and use it continuously to fulfill their tax obligations.
This finding is also in line with research(Saptono et al., 2023)And(Masunga et al., 2021)which shows that satisfaction with the use of digital tax systems can increase tax compliance behavior.
Although user satisfaction has a significant impact, descriptive analysis results show that respondents' satisfaction with Coretax remains relatively low. This indicates that some taxpayers still face challenges using the system, particularly related to technical issues and service stability.
These findings imply that the success of tax administration reform is measured not only by technology implementation but also by user experience when interacting with the system. Improved service quality, system response speed, and adequate technical support will contribute to increased satisfaction and strengthened taxpayer compliance.
5. Conclusions And Suggestions
5.1 Conclusion
BBased on the analysis results using Covariance-Based Structural Equation Modeling (CB-SEM) with LISREL, it can be concluded that taxpayer competence and satisfaction with the Coretax system have a positive and significant effect on taxpayer compliance in Indonesia. However, the quality of the information system does not affect Indonesian taxpayer compliance.
First, taxpayer competence has a positive and significant effect on taxpayer compliance and is the most dominant factor in the research model. This finding indicates that taxpayers' ability to understand tax provisions and utilize digital tax technology is a key factor driving compliance behavior. These results support the Theory of Planned Behavior (TPB).(Ajzen, 1991b), particularly the concept of perceived behavioral control, which explains that individuals are more likely to perform a behavior when they have confidence in their ability to carry out the action. This finding also strengthens the results of research.(Dimitras et al., 2025) (Nookhao & Kiattisin, 2023) (Bruns et al., 2025b)which found that digital competence and literacy play an important role in improving tax compliance.
Second, information system quality has no effect on taxpayer compliance. Based on empirical testing, information system quality has no significant effect on taxpayer compliance in Indonesia. This finding indicates that taxpayer compliance is more determined by internal factors, such as competence, tax understanding, and awareness of fulfilling tax obligations, than by perceptions of the quality of the Coretax system. Although the system quality is still considered suboptimal and frequently experiences disruptions, taxpayers still demonstrate a high level of compliance. Therefore, in the context of the current Coretax implementation, user behavior and competence are stronger explanatory factors for taxpayer compliance than the quality of the information system itself.
Third, satisfaction with the Coretax system has a positive and significant impact on taxpayer compliance. Taxpayers who are satisfied with the system's ease and benefits tend to be more compliant in fulfilling their tax obligations. This finding supports the Technology Acceptance Model (TAM), which explains that positive perceptions of the system will increase its acceptance and continued use. This finding aligns with research.(Masunga et al., 2021) (Saptono et al., 2023) (Dimitras et al., 2025)found that user satisfaction is an important factor in improving tax compliance.
Overall, this study provides evidence that, in the context of Coretax implementation in Indonesia, taxpayer competence is the most dominant factor in increasing taxpayer compliance, followed by satisfaction with system use. Meanwhile, the quality of the information system has not been able to directly influence compliance. These findings indicate that the success of digital tax transformation is not only determined by the sophistication of the technology used, but also depends heavily on the readiness, ability, and experience of users in utilizing that technology. Therefore, efforts to improve taxpayer compliance in the era of digital tax administration need to focus not only on system improvements but also on enhancing user competence and experience through tax education, digital literacy, and improving the quality of services oriented to taxpayer needs.
This study expands the literature on taxpayer compliance in a digital tax administration environment by demonstrating that user factors play a more dominant role than technology factors in the early stages of Coretax implementation. These findings imply that successful digital tax transformation requires not only investment in information systems development but also strategies focused on improving user competency and experience to achieve sustainable levels of tax compliance.
The primary contribution of this research is to provide evidence that taxpayer competence has a greater influence than information system quality and user satisfaction in driving tax compliance. These findings indicate that the success of Coretax implementation depends not on technological development, but on improving tax literacy and the digital competence of taxpayers as the system's primary users.
5.2 Implications and Recommendations
5.2.1 Theoretical Implications
This research makes several contributions to the development of digital taxation literature and taxpayer compliance behavior.
First, the research results strengthen the relevance of TPB theory.(Ajzen, 1991b)in explaining taxpayer compliance behavior in a digital tax administration environment. The finding that taxpayer competence has a positive and significant effect on compliance indicates that taxpayers' ability to understand regulations, implement tax administration, and use tax technology increases perceived behavioral control, which ultimately drives compliance behavior. This finding supports Ajzen's (1991) view that individuals tend to engage in a behavior when they perceive they have sufficient ability and control to do so.
Second, the research results also support the TAM theory, which explains that user experience and perceived benefits of technology influence user behavior. The positive influence of Coretax user satisfaction on taxpayer compliance suggests that a positive user experience can increase taxpayers' propensity to utilize the digital tax system sustainably and fulfill their tax obligations.
Third, this study provides a different perspective on ISSM.(DeLone & McLean, 2003). The model explains that system quality is a critical factor in the success of an information system. However, the research results show that information system quality does not directly influence taxpayer compliance. This finding indicates that in the context of the initial implementation of Coretax, technology quality was not necessarily the primary factor determining compliance behavior. Thus, this research broadens the understanding that the relationship between system quality and compliance behavior can be influenced by the implementation context, system maturity level, and user characteristics.
Fourth, this study shows that in the digital tax environment, human factors still play a more dominant role than technological factors. This finding adds to the literature on public sector digital transformation by demonstrating that successful technology implementation depends not only on the quality of the system developed but also on the readiness and competence of users in utilizing the technology.
5.2.2 Practical Implications
The research results provide several important implications for the Directorate General of Taxes (DGT) in increasing the effectiveness of Coretax implementation.
First, improving taxpayer competency needs to be a top priority in the digital tax transformation strategy. The finding that competency has the greatest influence on compliance suggests that investing in user education will have a greater impact than simply developing technology. Digital tax literacy programs, Coretax training, video tutorials, and mentoring for specific taxpayer groups need to be expanded on an ongoing basis.
Second, although information system quality was not proven to directly impact compliance, descriptive results indicate that respondents still gave low ratings to system stability, access speed, and frequency of disruptions in Coretax. Therefore, the DGT still needs to improve the system, particularly in terms of reliability, server capacity, response speed, and error minimization to enhance the user experience.
Third, the positive influence of user satisfaction on compliance demonstrates the importance of building a better user experience. Therefore, Coretax development needs to consider ease of use, the suitability of features to taxpayer needs, and the quality of user support services.
Fourth, compliance improvement strategies cannot be achieved solely through technological development, but also need to be integrated with competency enhancement, user assistance, and simplification of tax administration processes.
5.3 Research Limitations
Limitations in this study that need to be considered in interpreting the research results.
First, the perception-based survey approach used in data collection means that respondents' answers are highly dependent on each individual's experience and subjective judgment. This can lead to perceptual bias that does not fully reflect actual conditions.
Second, the study only used three independent variables: taxpayer competence, information system quality, and satisfaction with Coretax. Meanwhile, the coefficient of determination indicates that these three variables only explain 31.3% of the variation in taxpayer compliance, suggesting that other factors remain unaccounted for in the research model.
Third, the research was conducted during the early stages of Coretax implementation. Therefore, respondents' perceptions of system quality are likely still influenced by the ongoing user adaptation and system refinement process.
Fourth, the research used a purposive sampling technique so that the research results cannot be fully generalized to the entire taxpayer population in Indonesia.
Fifth, this study uses a cross-sectional design that describes conditions in a certain time period only and cannot capture changes in taxpayer perceptions and behavior after the implementation of Coretax has become more mature.
5.4 Recommendations for Further Research
Based on the results and limitations of the research, several recommendations for further research can be put forward.
First, further research can add other variables that have the potential to influence taxpayer compliance, such as tax awareness, trust in government, perceived risk, quality of tax services, digital literacy, and perceptions of tax sanctions.
Second, considering that the quality of information systems has not been proven to have a direct effect on taxpayer compliance, subsequent research can test the possibility of mediating variables, such as user satisfaction, trust in the system, or technology acceptance, so that the relationship between system quality and compliance can be explained more comprehensively.
Third, further research can use a longitudinal approach to observe changes in taxpayer perceptions and behavior as Coretax implementation in Indonesia matures.
Fourth, subsequent research can expand the scope of respondents based on region, business sector, or specific taxpayer category so that a deeper understanding is obtained regarding the differences in compliance behavior between taxpayer groups.
Fifth, further research can combine quantitative and qualitative approaches (mixed methods) to gain a deeper understanding of the factors that influence taxpayer compliance in a digital tax administration environment.
Because the research results indicate that information system quality does not directly influence taxpayer compliance, future research is recommended to develop a more complex model by incorporating user satisfaction, system trust, or technology acceptance as mediating variables. This approach has the potential to provide a more comprehensive explanation of the mechanisms by which digital system quality can influence taxpayer compliance behavior in the context of modern tax administration transformation.
References
- Ajzen, I. (1991a). The theory of planned behavior. Organizational Behavior and Human Decision Processes. 50(2), 179–211. DOI ↗ Google Scholar ↗
- Ajzen, I. (1991b). The theory of planned behavior. Organizational Behavior and Human Decision Processes, 50(2), 179–211. DOI ↗ Google Scholar ↗
- Belahouaoui, R., & Attak, E. H. (2024). Digital taxation, artificial intelligence and Tax Administration 3.0: improving tax compliance behavior – a systematic literature review using textometry (2016–2023). Accounting Research Journal, 37(2), 172–191. DOI ↗ Google Scholar ↗
- Bellon, M., Dabla-Norris, E., Khalid, S., & Lima, F. (2022). Digitalization to improve tax compliance: Evidence from VAT e-Invoicing in Peru. Journal of Public Economics, 210. DOI ↗ Google Scholar ↗
- Bruns, C., Fochmann, M., Mohr, P. N. C., & Torgler, B. (2025a). Multidimensional tax compliance attitude. Journal of Economic Psychology, 110(September 2024), 102848. DOI ↗ Google Scholar ↗
- Bruns, C., Fochmann, M., Mohr, P. N. C., & Torgler, B. (2025b). Multidimensional tax compliance attitude. Journal of Economic Psychology, 110(July), 102848. DOI ↗ Google Scholar ↗
- Cooper, D. R, & Schindler, P. S. (2014). Business Research Methods (12th ed.). Mc Graw Hill Companies, Inc. New York. DOI ↗ Google Scholar ↗
- Davis, F.D. (1989). Perceived usefulness, perceived ease of use, and user acceptance of information technology. MIS Quarterly, 13(3), 319–340. DOI ↗ Google Scholar ↗
- DeLone, W. H., & McLean, E. R. (2003). The DeLone and McLean model of information systems success: A ten-year update. Journal of Management Information Systems, 19(4), 9–30. DOI ↗ Google Scholar ↗
- Dimitras, A., Fourlas, V., Kirchler, E., & Peppas, G. (2025). Drivers of tax compliance: Survey evidence from 1761 Greek micro-firms. Journal of Behavioral and Experimental Economics, 119(June), 102480. DOI ↗ Google Scholar ↗
- Hair, JF, Black, WC, Babin, BJ, & Anderson, RE (2019). Multivariate Data Analysis. Cengage. DOI ↗ Google Scholar ↗
- Kirchler, E. (2005). Word count: app. 88,700 1. 1–303. DOI ↗ Google Scholar ↗
- Kline, R.B. (2015). Principles and Practice of Structural Equation Modeling, Fourth Edition. Guilford Publications. DOI ↗ Google Scholar ↗
- Kusumawardhani, A., Gunawan, FK, Sany, S., Tjondro, E., & Eoh, TS (2024). Tax Service Quality and Digital Tax Implementation for MSME Tax Compliance in Surabaya. International Journal of Organizational Behavior and Policy, 3(1), 53–62. DOI ↗ Google Scholar ↗
- Ling, X. (2025). Can the digitalization of tax administration promote corporate digital transformation? —— empirical evidence from China. International Review of Economics and Finance, 104(June), 104634. DOI ↗ Google Scholar ↗
- Masunga, FJ, Mapesa, HJ, Mwakibete, AN, Derefa, MJ, Myava, JE, & Kiria, JS (2021). The Role of Mediating Effects of User Satisfaction and Behavioral Intention on the Influence of the e-Tax System on Tax Compliance Behavior: An application of Bootstrapping Technique. TIJAB (The International Journal of Applied Business), 5(2), 137. DOI ↗ Google Scholar ↗
- Nookhao, S., & Kiattisin, S. (2023). Achieving a successful e-government: Determinants of behavioral intention from Thai citizens' perspective. Heliyon, 9(8), e18944. DOI ↗ Google Scholar ↗
- Nugraha, A., & Yustini, T. (2024). The Effect of Service Quality, Information Quality, and System Quality on Net Benefit Mediating User Satisfaction and Intention to Use. EDUNOMIKA SCIENTIFIC JOURNAL, 8(3). DOI ↗ Google Scholar ↗
- Rusli, D., Chusnah, FN, & Supriati, D. (2024). Taxpayer Compliance of MSME: The Role of Tax Knowledge, Tax Office Service Quality, and Trust in the Government. 1(2), 61–70. DOI ↗ Google Scholar ↗
- Saptono, PB, Hodžić, S., Khozen, I., Mahmud, G., Pratiwi, I., Purwanto, D., Aditama, MA, Haq, N., & Khodijah, S. (2023). Quality of E-Tax System and Tax Compliance Intention: The Mediating Role of User Satisfaction. Informatics, 10(1), 1–24. DOI ↗ Google Scholar ↗
- Timothy, J., & Abbas, Y. (2021). Tax morale, perception of justice, trust in public authorities, tax knowledge, and tax compliance: A study of Indonesian SMEs. EJournal of Tax Research, 19(1), 168–184. DOI ↗ Google Scholar ↗
- Zhou, D., & Zhang, Z. (2024). Big data tax collection and management, enterprise financialization and enterprise innovation: Quasi-natural test evidence based on the “Golden Tax Phase III.” PLOS ONE, 19(12 December), 1–19. DOI ↗ Google Scholar ↗
- Diana Widjaja, Nazmi Muslim, Maria Goreti Retno Anjasmarni. (2026) The Effect of Information Quality and User Satisfaction on Taxpayer Compliance: a Study on the Coretax System in Bandung City-Indonesia. International Journal of Innovative Technologies in Economy. 1(53). doi: DOI ↗ Google Scholar ↗
Appendix
1 Operational Definition of Variables
| Variables | Definition | Indicator | Source |
|---|---|---|---|
| Taxpayer Competence (X₁) | The concept of perceived behavioral control, which is an individual's belief in their ability to perform a behavior. In the context of digital taxation, taxpayer competence reflects the ability to understand tax regulations, digital literacy, and the ability to use the Coretax system. | 1. Tax Knowledge 2. Tax Calculation Ability 3. Administrative Skills (Tax Administration Skills) 4. Tax Technology Literacy 5. Understanding Tax Rights and Obligations (Awareness and Rights) 6. Regulatory Adaptability | Theory of Planned Behavior (Ajzen, 1991) Saptono et al. (2023), Hesami et al. (2024) |
| Information System Quality (X₂) | User perception of the quality of information provided by the Coretax system | 1. System Reliability 2. System Speed (Response Time) 3. Ease of Use 4. System Security 5. System Availability (uptime) 6. User interface & navigation (User Friendly) 7. Minimal errors / bugs | Information Systems Success Model, DeLone & McLean (2003), adaptation of Saptono's research (2023) |
| User Satisfaction (X₃) | The level of taxpayer satisfaction with the experience of using the Coretax system in fulfilling tax obligations. | 1. Overall satisfaction with system use 2. System conformance to expectations 3. Perceived benefits of using the system 4. System usage experience | TAM, F. Davis (1989), DeLone & McLean, (2016), Saptono (2023) |
| Taxpayer Compliance (Y) | Taxpayer behavior in carrying out tax obligations in accordance with applicable provisions. | 1. Timeliness of reporting 2. Payment compliance 3. Accuracy of reporting calculations 4. Tax awareness |
2 Lisrel Diagram
Path Diagram Standardized Coefficient
Path Diagram Tvalue
3 SEM-Lisrel Output
DATE: 6/6/2026
TIME: 15:45
LISREL 8.70
BY
Karl G. Jöreskog & Dag Sörbom
This program is published exclusively by
Scientific Software International, Inc.
7383 N. Lincoln Avenue, Suite 100
Lincolnwood, IL 60712, USA
Phone: (800)247-6113, (847)675-0720, Fax: (847)675-2140
Copyright by Scientific Software International, Inc., 1981-2004
Use of this program is subject to the terms specified in the
Universal Copyright Convention.
Website: www.ssicentral.com
The following lines were read from file D:\MAY 2026\DATA THESIS\WP.spj Compliance:
Taxpayer Compliance
Observed variables X1.1 X1.2 X1.3 X1.4 X1.5 X1.6
Covariance matrix from fileolah.cov
Asymptotic covariance matrix from fileolah.acc
Sample size 270
Latent variables X1 X2 X3 Y
Relationship
X1.1 X1.2 X1.3 X1.4 X1.5 X1.6 = X1
X2.1 X2.2 X2.3 X2.4 X2.5 X2.6
X3.1 X3.2 X3.3 X3.4 = X3
Y.1 Y.2 Y.3 Y.4 = Y
Y = X1 X2 X3
Let error covariance of X2.6 and X2.2 correlated
Let error covariance of X2.6 and X2.3 correlated
Let error covariance of X2.7 and X2.2 correlated
Let error covariance of X2.7 and X2.3 correlated
Let error covariance of X2.7 and X2.5 correlated
Let error covariance of X1.6 and X1.5 correlated
Let error covariance of X2.3 and X2.2 correlated
Let error covariance of X2.3 and X2.1 correlated
Let error covariance of X2.6 and X2.7 correlated
Let error covariance of X2.6 and X2.1 correlated
Let error covariance of X2.4 and X2.2 correlated
Let error covariance of X3.1 and X1.5 correlated
Let error covariance of X2.4 and X1.5 correlated
Let error covariance of X3.1 and X2.3 correlated
Let error covariance of X3.2 and X3.3 correlated
Let error covariance of X2.7 and X3.1 correlated
Let error covariance of X2.2 and X1.5 correlated
Path diagram
Lisrel output: ND=3 SC
Options: AD=OFF
Options: IT=1000
End of problem
Sample Size = 270
Taxpayer Compliance
Covariance Matrix
Y.1 Y.2 Y.3 Y.4 X1.1 X1.2
-------- -------- -------- -------- -------- --------
Y.1 0.535
Y.2 0.409 0.481
Y.3 0.373 0.364 0.409
Y.4 0.379 0.397 0.346 0.606
X1.1 0.206 0.177 0.170 0.158 0.348
X1.2 0.185 0.158 0.170 0.144 0.323 0.467
X1.3 0.189 0.171 0.163 0.156 0.302 0.341
X1.4 0.146 0.090 0.078 0.110 0.293 0.328
X1.5 0.235 0.189 0.203 0.149 0.246 0.255
X1.6 0.243 0.207 0.219 0.197 0.306 0.322
X2.1 0.136 0.121 0.100 0.128 0.071 0.097
X2.2 0.000 -0.002 -0.009 -0.016 -0.049 -0.029
X2.3 0.014 0.028 0.001 0.073 -0.007 0.009
X2.4 0.135 0.122 0.109 0.146 0.051 0.055
X2.5 -0.119 -0.099 -0.113 -0.019 -0.096 -0.048
X2.6 0.175 0.134 0.123 0.194 0.083 0.085
X2.7 -0.036 -0.026 -0.033 0.021 -0.121 -0.086
X3.1 0.193 0.148 0.136 0.190 0.047 0.057
X3.2 0.177 0.127 0.096 0.140 0.141 0.149
X3.3 0.080 0.052 0.047 0.131 -0.006 0.005
X3.4 0.154 0.118 0.100 0.132 0.108 0.125
Covariance Matrix
X1.3 X1.4 X1.5 X1.6 X2.1 X2.2
-------- -------- -------- -------- -------- --------
X1.3 0.408
X1.4 0.349 0.826
X1.5 0.248 0.306 0.404
X1.6 0.321 0.358 0.306 0.405
X2.1 0.075 0.178 0.067 0.096 0.689
X2.2 -0.031 0.127 0.042 0.006 0.497 0.765
X2.3 0.005 0.212 -0.001 0.029 0.477 0.500
X2.4 0.078 0.229 0.139 0.113 0.363 0.373
X2.5 -0.091 0.184 -0.065 -0.081 0.446 0.619
X2.6 0.057 0.233 0.072 0.111 0.540 0.443
X2.7 -0.109 0.120 -0.017 -0.060 0.472 0.689
X3.1 0.024 0.110 0.120 0.053 0.091 0.100
X3.2 0.132 0.240 0.102 0.125 0.139 0.104
X3.3 -0.012 0.051 -0.001 -0.002 0.047 0.036
X3.4 0.098 0.146 0.077 0.114 0.258 0.189
Covariance Matrix
X2.3 X2.4 X2.5 X2.6 X2.7 X3.1
-------- -------- -------- -------- -------- --------
X2.3 0.763
X2.4 0.428 0.527
X2.5 0.603 0.364 1.131
X2.6 0.630 0.430 0.499 0.949
X2.7 0.457 0.371 0.805 0.462 1.144
X3.1 -0.014 0.105 0.078 0.048 0.183 0.751
X3.2 0.114 0.133 0.122 0.124 0.102 0.568
X3.3 0.070 0.095 0.085 0.078 0.097 0.473
X3.4 0.249 0.255 0.160 0.313 0.149 0.395
Covariance Matrix
X3.2 X3.3 X3.4
-------- -------- --------
X3.2 0.978
X3.3 0.567 0.738
X3.4 0.463 0.341 0.753
Taxpayer Compliance
Number of Iterations = 19
LISREL Estimates (Robust Maximum Likelihood)
Measurement Equations
Y.1 = 0.645*Y, Errorvar.= 0.118 , R² = 0.779
(0.0238)
4,980
Y.2 = 0.636*Y, Errorvar.= 0.0769 , R² = 0.840
(0.0216) (0.0173)
29,494 4,459
Y.3 = 0.574*Y, Errorvar.= 0.0798 , R² = 0.805
(0.0288) (0.0183)
19,944 4,355
Y.4 = 0.607*Y, Errorvar.= 0.238 , R² = 0.608
(0.0405) (0.0278)
14,985 8,548
X1.1 = 0.539*X1, Errorvar.= 0.0577 , R² = 0.834
(0.0271) (0.00832)
19,860 6,931
X1.2 = 0.587*X1, Errorvar.= 0.123 , R² = 0.737
(0.0303) (0.0198)
19,346 6,206
X1.3 = 0.566*X1, Errorvar.= 0.0876 , R² = 0.785
(0.0270) (0.0152)
20,970 5,770
X1.4 = 0.581*X1, Errorvar.= 0.488 , R² = 0.408
(0.0452) (0.0347)
12,850 14,059
X1.5 = 0.446*X1, Errorvar.= 0.189 , R² = 0.513
(0.0320) (0.0230)
13,926 8,189
X1.6 = 0.569*X1, Errorvar.= 0.0810 , R² = 0.800
(0.0269) (0.0117)
21,114 6,900
X2.1 = 0.633*X2, Errorvar.= 0.287 , R² = 0.583
(0.0513) (0.0599)
12,340 4,802
X2.2 = 0.797*X2, Errorvar.= 0.122 , R² = 0.839
(0.0439) (0.0356)
18,145 3,432
X2.3 = 0.794*X2, Errorvar.= 0.0994 , R² = 0.864
(0.0455) (0.0445)
17,479 2,232
X2.4 = 0.527*X2, Errorvar.= 0.245 , R² = 0.531
(0.0393) (0.0311)
13,400 7,888
X2.5 = 0.752*X2, Errorvar.= 0.566 , R² = 0.499
(0.0496) (0.0491)
15,144 11,543
X2.6 = 0.746*X2, Errorvar.= 0.390 , R² = 0.588
(0.0591) (0.0693)
12,627 5,631
X2.7 = 0.757*X2, Errorvar.= 0.588 , R² = 0.494
(0.0538) (0.0703)
14,069 8,360
X3.1 = 0.719*X3, Errorvar.= 0.223 , R² = 0.699
(0.0558) (0.0388)
12,886 5,746
X3.2 = 0.786*X3, Errorvar.= 0.360 , R² = 0.632
(0.0529) (0.0542)
14,864 6,638
X3.3 = 0.625*X3, Errorvar.= 0.347 , R² = 0.529
(0.0540) (0.0367)
11,570 9,463
X3.4 = 0.582*X3, Errorvar.= 0.415 , R² = 0.450
(0.0520) (0.0491)
11,201 8,443
Error Covariance for X1.6 and X1.5 = 0.0381
(0.0114)
3,338
Error Covariance for X2.2 and X1.5 = 0.0365
(0.0162)
2,250
Error Covariance for X2.3 and X2.1 = -0.043
(0.0382)
-1.124
Error Covariance for X2.3 and X2.2 = -0.138
(0.0284)
-4,856
Error Covariance for X2.4 and X1.5 = 0.0671
(0.0188)
3,568
Error Covariance for X2.4 and X2.2 = -0.049
(0.0202)
-2,407
Error Covariance for X2.6 and X2.1 = 0.0617
(0.0584)
1,057
Error Covariance for X2.6 and X2.2 = -0.146
(0.0310)
-4,693
Error Covariance for X2.6 and X2.3 = 0.00572
(0.0473)
0.121
Error Covariance for X2.7 and X2.2 = 0.0678
(0.0391)
1,731
Error Covariance for X2.7 and X2.3 = -0.132
(0.0316)
-4.193
Error Covariance for X2.7 and X2.5 = 0.245
(0.0418)
5,869
Error Covariance for X2.7 and X2.6 = -0.050
(0.0334)
-1,504
Error Covariance for X3.1 and X1.5 = 0.0701
(0.0171)
4,089
Error Covariance for X3.1 and X2.3 = -0.087
(0.0192)
-4,528
Error Covariance for X3.1 and X2.7 = 0.0835
(0.0251)
3,322
Error Covariance for X3.3 and X3.2 = 0.0762
(0.0387)
1,966
Structural Equations
Y = 0.493*X1 + 0.0174*X2 + 0.188*X3, Errorvar.= 0.687 , R² = 0.313
(0.0577) (0.0547) (0.0592) (0.0952)
8,552 0.318 3.175 7,218
Correlation Matrix of Independent Variables
X1 X2 X3
-------- -------- --------
X1 1,000
X2 0.010 1.000
(0.058)
0.167
X3 0.176 0.204 1.000
(0.069) (0.066)
2,551 3,107
Covariance Matrix of Latent Variables
Y X1 X2 X3
-------- -------- -------- --------
Y 1,000
X1 0.527 1.000
X2 0.061 0.010 1.000
X3 0.279 0.176 0.204 1.000
Goodness of Fit Statistics
Degrees of Freedom = 166
Minimum Fit Function Chi-Square = 519.287 (P = 0.0)
Normal Theory Weighted Least Squares Chi-Square = 497.417 (P = 0.0)
Satorra-Bentler Scaled Chi-Square = 440.586 (P = 0.0)
Chi-Square Corrected for Non-Normality = 1554.126 (P = 0.0)
Estimated Non-centrality Parameter (NCP) = 274.586
90 Percent Confidence Interval for NCP = (216,170 ; 340,667)
Minimum Fit Function Value = 1.930
Population Discrepancy Function Value (F0) = 1.021
90 Percent Confidence Interval for F0 = (0.804 ; 1.266)
Root Mean Square Error of Approximation (RMSEA) = 0.0784
90 Percent Confidence Interval for RMSEA = (0.0696 ; 0.0873)
P-Value for Test of Close Fit (RMSEA < 0.05) = 0.000
Expected Cross-Validation Index (ECVI) = 2.121
90 Percent Confidence Interval for ECVI = (1.904 ; 2.367)
ECVI for Saturated Model = 1.717
ECVI for Independence Model = 27,949
Chi-Square for Independence Model with 210 Degrees of Freedom = 7476.372
Independence AIC = 7518.372
AIC Model = 570.586
Saturated AIC = 462,000
Independence CAIC = 7614.939
CAIC Model = 869.483
Saturated CAIC = 1524.235
Normed Fit Index (NFI) = 0.941
Non-Normed Fit Index (NNFI) = 0.952
Parsimony Normed Fit Index (PNFI) = 0.744
Comparative Fit Index (CFI) = 0.962
Incremental Fit Index (IFI) = 0.962
Relative Fit Index (RFI) = 0.925
Critical N (CN) = 130.015
Root Mean Square Residual (RMR) = 0.0662
Standardized RMR = 0.100
Goodness of Fit Index (GFI) = 0.850
Adjusted Goodness of Fit Index (AGFI) = 0.792
Parsimony Goodness of Fit Index (PGFI) = 0.611
The Modification Indices Suggest to Add the
Path to from Decrease in Chi-Square New Estimate
X1.4 X2 26.0 0.22
X2.1 X1 11.6 0.11
X2.3 X1 8.1 -0.08
X2.4 X1 19.1 0.14
X2.4 X3 8.4 0.10
X3.2 X1 17.0 0.17
X3.3 X1 17.0 -0.16
X3.4 X2 28.0 0.24
The Modification Indices Suggest to Add an Error Covariance
Between and Decrease in Chi-Square New Estimate
X1.2 X1.1 9.0 0.03
X1.3 X1.2 8.5 0.04
X1.4 Y.3 10.3 -0.05
X2.4 X1.6 9.4 0.03
X2.7 X1.5 8.4 0.06
X3.1 X2.6 10.2 -0.08
X3.4 X2.4 10.4 0.07
X3.4 X2.6 8.3 0.07
Taxpayer Compliance
Standardized Solution
LAMBDA-Y
Y
--------
Y.1 0.645
Y.2 0.636
Y.3 0.574
Y.4 0.607
LAMBDA-X
X1 X2 X3
-------- -------- --------
X1.1 0.539 - - - -
X1.2 0.587 - - - -
X1.3 0.566 - - - -
X1.4 0.581 - - - -
X1.5 0.446 - - - -
X1.6 0.569 - - - -
X2.1 - - 0.633 - -
X2.2 - - 0.797 - -
X2.3 - - 0.794 - -
X2.4 - - 0.527 - -
X2.5 - - 0.752 - -
X2.6 - - 0.746 - -
X2.7 - - 0.757 - -
X3.1 - - - - 0.719
X3.2 - - - - 0.786
X3.3 - - - - 0.625
X3.4 - - - - 0.582
GAMMA
X1 X2 X3
-------- -------- --------
Y 0.493 0.017 0.188
Correlation Matrix of ETA and KSI
Y X1 X2 X3
-------- -------- -------- --------
Y 1,000
X1 0.527 1.000
X2 0.061 0.010 1.000
X3 0.279 0.176 0.204 1.000
PSI
Y
--------
0.687
Regression Matrix ETA on KSI (Standardized)
X1 X2 X3
-------- -------- --------
Y 0.493 0.017 0.188
Taxpayer Compliance
Completely Standardized Solution
LAMBDA-Y
Y
--------
Y.1 0.882
Y.2 0.917
Y.3 0.897
Y.4 0.780
LAMBDA-X
X1 X2 X3
-------- -------- --------
X1.1 0.913 - - - -
X1.2 0.858 - - - -
X1.3 0.886 - - - -
X1.4 0.639 - - - -
X1.5 0.716 - - - -
X1.6 0.894 - - - -
X2.1 - - 0.763 - -
X2.2 - - 0.916 - -
X2.3 - - 0.929 - -
X2.4 - - 0.729 - -
X2.5 - - 0.707 - -
X2.6 - - 0.767 - -
X2.7 - - 0.703 - -
X3.1 - - - - 0.836
X3.2 - - - - 0.795
X3.3 - - - - 0.727
X3.4 - - - - 0.671
GAMMA
X1 X2 X3
-------- -------- --------
Y 0.493 0.017 0.188
Correlation Matrix of ETA and KSI
Y X1 X2 X3
-------- -------- -------- --------
Y 1,000
X1 0.527 1.000
X2 0.061 0.010 1.000
X3 0.279 0.176 0.204 1.000
PSI
Y
--------
0.687
THETA-EPS
Y.1 Y.2 Y.3 Y.4
-------- -------- -------- --------
0.221 0.160 0.195 0.392
THETA-DELTA
X1.1 X1.2 X1.3 X1.4 X1.5 X1.6
-------- -------- -------- -------- -------- --------
X1.1 0.166
X1.2 - - 0.263
X1.3 - - - - 0.215
X1.4 - - - - - - 0.592
X1.5 - - - - - - - - 0.487
X1.6 - - - - - - - - 0.096 0.200
X2.1 - - - - - - - - - - - -
X2.2 - - - - - - - - 0.067 - -
X2.3 - - - - - - - - - - - -
X2.4 - - - - - - - - 0.149 - -
X2.5 - - - - - - - - - - - -
X2.6 - - - - - - - - - - - -
X2.7 - - - - - - - - - - - -
X3.1 - - - - - - - - 0.131 - -
X3.2 - - - - - - - - - - - -
X3.3 - - - - - - - - - - - -
X3.4 - - - - - - - - - - - -
THETA-DELTA
X2.1 X2.2 X2.3 X2.4 X2.5 X2.6
-------- -------- -------- -------- -------- --------
X2.1 0.417
X2.2 - - 0.161
X2.3 -0.061 -0.186 0.136
X2.4 - - -0.077 - - 0.469
X2.5 - - - - - - - - 0.501
X2.6 0.076 -0.172 0.007 - - - - 0.412
X2.7 - - 0.072 -0.144 - - 0.214 -0.048
X3.1 - - - - -0.118 - - - - - -
X3.2 - - - - - - - - - - - -
X3.3 - - - - - - - - - - - -
X3.4 - - - - - - - - - - - -
THETA-DELTA
X2.7 X3.1 X3.2 X3.3 X3.4
-------- -------- -------- -------- --------
X2.7 0.506
X3.1 0.090 0.301
X3.2 - - - - 0.368
X3.3 - - - - 0.090 0.471
X3.4 - - - - - - - - 0.550
Regression Matrix ETA on KSI (Standardized)
X1 X2 X3
-------- -------- --------
Y 0.493 0.017 0.188
Time used: 1.219 seconds
4 Output Validity and Reliability
Reliability
Scale: ALL VARIABLES
| Case Processing Summary | |||
| N | % | ||
| Cases | Valid | 270 | 100.0 |
| Excluded | 0 | .0 | |
| Total | 270 | 100.0 | |
| a. Listwise deletion based on all variables in the procedure. |
| Reliability Statistics | |
| Cronbach's Alpha | N of Items |
| .941 | 20 |
| Item Statistics | |||
| Mean | Standard Deviation | N | |
| Competency_WP.1 | 3.7111 | .67197 | 270 |
| Competency_WP.2 | 3.9333 | .67565 | 270 |
| Competency_WP.3 | 4.0926 | .68082 | 270 |
| Competency_WP.4 | 3.9296 | .68348 | 270 |
| Competency_WP.5 | 3.9778 | .73131 | 270 |
| Competency_WP.6 | 3.5370 | .98148 | 270 |
| Competency_WP.7 | 4.2259 | .76450 | 270 |
| Competency_WP.8 | 2.8741 | 1.09020 | 270 |
| Competency_WP.9 | 3.3481 | 1.00422 | 270 |
| Competency_WP.10 | 2.7815 | 1.14409 | 270 |
| Competency_WP.11 | 2.8704 | 1.13816 | 270 |
| Competency_WP.12 | 3.3963 | .90146 | 270 |
| Competence_WP.13 | 3.1593 | 1.05983 | 270 |
| Competence_WP.14 | 3.5926 | .82070 | 270 |
| Competence_WP.15 | 4.2074 | .75758 | 270 |
| Competence_WP.16 | 4.2222 | .70227 | 270 |
| Competency_WP.17 | 4.1519 | .73867 | 270 |
| Competence_WP.18 | 3.7667 | .78152 | 270 |
| Competence_WP.19 | 3.6148 | .83140 | 270 |
| Competence_WP.20 | 3.7556 | .77572 | 270 |
| Item-Total Statistics | ||||
|---|---|---|---|---|
| Scale Mean if Item Deleted | Scale Variance if Item Deleted | Corrected Item-Total Correlation | Cronbach's Alpha if Item Deleted | |
| Competency_WP.1 | 69.4370 | 128,366 | .724 | .937 |
| Competency_WP.2 | 69.2148 | 127,872 | .753 | .937 |
| Competency_WP.3 | 69.0556 | 130,224 | .589 | .939 |
| Competency_WP.4 | 69.2185 | 127,867 | .744 | .937 |
| Competency_WP.5 | 69.1704 | 127,629 | .706 | .937 |
| Competency_WP.6 | 69.6111 | 124,633 | .650 | .938 |
| Competency_WP.7 | 68.9222 | 130,711 | .489 | .940 |
| Competency_WP.8 | 70.2741 | 126,036 | .515 | .941 |
| Competency_WP.9 | 69,8000 | 121,848 | .766 | .936 |
| Competency_WP.10 | 70.3667 | 123,185 | .604 | .940 |
| Competency_WP.11 | 70.2778 | 121,852 | .664 | .938 |
| Competency_WP.12 | 69.7519 | 124,908 | .701 | .937 |
| Competence_WP.13 | 69.9889 | 122,985 | .669 | .938 |
| Competence_WP.14 | 69.5556 | 127,936 | .605 | .939 |
| Competence_WP.15 | 68.9407 | 130,562 | .503 | .940 |
| Competence_WP.16 | 68.9259 | 130,084 | .578 | .939 |
| Competency_WP.17 | 68.9963 | 128,888 | .620 | .938 |
| Competence_WP.18 | 69.3815 | 125,687 | .773 | .936 |
| Competence_WP.19 | 69.5333 | 124,681 | .779 | .936 |
| Competence_WP.20 | 69.3926 | 125,957 | .763 | .936 |
Reliability
Scale: ALL VARIABLES
| Case Processing Summary | |||
| N | % | ||
| Cases | Valid | 270 | 100.0 |
| Excluded | 0 | .0 | |
| Total | 270 | 100.0 | |
| a. Listwise deletion based on all variables in the procedure. |
| Reliability Statistics | |
| Cronbach's Alpha | N of Items |
| .937 | 13 |
| Item Statistics | |||
| Mean | Standard Deviation | N | |
| Quality_SI.1 | 3.1852 | .98830 | 270 |
| Quality_SI.2 | 2.3630 | .97636 | 270 |
| Quality_SI.3 | 2.1481 | .97948 | 270 |
| Quality_SI.4 | 2.3889 | .91693 | 270 |
| Quality_SI.5 | 2.5259 | 1.01168 | 270 |
| Quality_SI.6 | 2.7630 | .99968 | 270 |
| Quality_SI.7 | 2.9889 | .96590 | 270 |
| Quality_SI.8 | 2.9778 | .94823 | 270 |
| Quality_SI.9 | 3.0519 | .97415 | 270 |
| Quality_SI.10 | 3.1037 | .84725 | 270 |
| Quality_SI.11 | 3.1296 | .82809 | 270 |
| Quality_SI.12 | 2.2037 | 1.06968 | 270 |
| Quality_SI.13 | 2.2630 | 1.06364 | 270 |
| Item-Total Statistics | ||||
| Scale Mean if Item Deleted | Scale Variance if Item Deleted | Corrected Item-Total Correlation | Cronbach's Alpha if Item Deleted | |
| Quality_SI.1 | 31,9074 | 77,765 | .659 | .933 |
| Quality_SI.2 | 32.7296 | 79,127 | .584 | .936 |
| Quality_SI.3 | 32.9444 | 77,830 | .662 | .933 |
| Quality_SI.4 | 32.7037 | 76,581 | .798 | .929 |
| Quality_SI.5 | 32.5667 | 75,295 | .792 | .929 |
| Quality_SI.6 | 32.3296 | 76,296 | .740 | .931 |
| Quality_SI.7 | 32.1037 | 76,852 | .735 | .931 |
| Quality_SI.8 | 32.1148 | 76,920 | .746 | .930 |
| Quality_SI.9 | 32.0407 | 76,508 | .749 | .930 |
| Quality_SI.10 | 31.9889 | 79,260 | .679 | .933 |
| Quality_SI.11 | 31.9630 | 79,523 | .678 | .933 |
| Quality_SI.12 | 32.8889 | 76,791 | .656 | .934 |
| Quality_SI.13 | 32.8296 | 75,949 | .709 | .932 |
Reliability
Scale: ALL VARIABLES
| Case Processing Summary | |||
| N | % | ||
| Cases | Valid | 270 | 100.0 |
| Excluded | 0 | .0 | |
| Total | 270 | 100.0 | |
| a. Listwise deletion based on all variables in the procedure. |
| Reliability Statistics | |
| Cronbach's Alpha | N of Items |
| .847 | 4 |
| Item Statistics | |||
| Mean | Standard Deviation | N | |
| Satisfaction.1 | 2.0148 | .86643 | 270 |
| Satisfaction.2 | 2.5370 | .98903 | 270 |
| Satisfaction.3 | 2.4370 | .85887 | 270 |
| Satisfaction.4 | 3.1963 | .86784 | 270 |
| Item-Total Statistics | ||||
| Scale Mean if Item Deleted | Scale Variance if Item Deleted | Corrected Item-Total Correlation | Cronbach's Alpha if Item Deleted | |
| Satisfaction.1 | 8.1704 | 5,213 | .726 | .790 |
| Satisfaction.2 | 7.6481 | 4,660 | .749 | .779 |
| Satisfaction.3 | 7.7481 | 5,334 | .697 | .802 |
| Satisfaction.4 | 6.9889 | 5,684 | .580 | .849 |
Reliability
Scale: ALL VARIABLES
| Case Processing Summary | |||
| N | % | ||
| Cases | Valid | 270 | 100.0 |
| Excluded | 0 | .0 | |
| Total | 270 | 100.0 | |
| a. Listwise deletion based on all variables in the procedure. |
| Reliability Statistics | |
| Cronbach's Alpha | N of Items |
| .938 | 7 |
| Item Statistics | |||
| Mean | Standard Deviation | N | |
| Compliance_WP.1 | 4.1741 | .85538 | 270 |
| Compliance_WP.2 | 4.2111 | .83369 | 270 |
| Compliance_WP.3 | 4.2037 | .80840 | 270 |
| Compliance_WP.4 | 4.2778 | .72185 | 270 |
| Compliance_WP.5 | 4.2889 | .69375 | 270 |
| Compliance_WP.6 | 3.9889 | .77835 | 270 |
| Compliance_WP.7 | 4.3593 | .63991 | 270 |
| Item-Total Statistics | ||||
| Scale Mean if Item Deleted | Scale Variance if Item Deleted | Corrected Item-Total Correlation | Cronbach's Alpha if Item Deleted | |
| Compliance_WP.1 | 25.3296 | 14,973 | .789 | .930 |
| Compliance_WP.2 | 25.2926 | 14,996 | .811 | .928 |
| Compliance_WP.3 | 25,3000 | 14,813 | .878 | .921 |
| Compliance_WP.4 | 25.2259 | 15,677 | .827 | .926 |
| Compliance_WP.5 | 25.2148 | 15,790 | .844 | .925 |
| Compliance_WP.6 | 25.5148 | 16,288 | .642 | .943 |
| Compliance_WP.7 | 25.1444 | 16,198 | .839 | .927 |