Abstract
This study aims to assess the digital innovation and service quality of selected fast casual restaurants in Metro Manila as a basis for developing a competitive v advantage plan. Specifically, it seeks to evaluate how restaurant managers, staff, and customers perceive digital innovation in terms of online ordering systems, mobile application features, integration with third-party delivery platforms, data analytics usage, contactless payment solutions, and loyalty program automation; determine whether significant differences exist among the assessments of these groups; examine the level of service quality in terms of responsiveness, reliability, tangibles, assurance, empathy, and complaint handling; and identify any significant relationship between digital innovation and service quality. Furthermore, the study aims to determine the problems encountered in both areas, develop a competitive advantage plan based on the findings, and assess its acceptability among the respondents.
Keywords
RESTAURANT FOOD INNOVATION MANAGERS STAFF CUSTOMERS
The Problem and Its Background
Introduction
The rapid advancement of digital technologies has transformed the way organizations create value, deliver services, and sustain competitiveness in today's business environment. Across the service sector, digital innovation has become an essential strategic capability that enables organizations to improve operational efficiency, enhance customer experiences, and respond more effectively to changing consumer demands. In the restaurant industry, technologies such as online ordering systems, mobile applications, contactless payment solutions, data analytics, loyalty program automation, and third-party delivery platform integration have fundamentally changed how businesses interact with customers and manage daily operations. According to Statista (2024), the continuous growth of the global online food delivery market reflects consumers' increasing preference for digitally enabled dining experiences, highlighting the growing importance of digital transformation as a driver of business competitiveness.
Concurrently, service quality remains a pivotal determinant of customer satisfaction and long-term business competitiveness in service industries. Established dimensions of service quality—responsiveness, reliability, tangibles, assurance, and empathy—continue to guide the evaluation of customer experiences. Digital innovations have the potential to enhance these dimensions by enabling greater speed, accuracy, and accessibility in service delivery. However, the mere adoption of technology does not guarantee improved service outcomes; its effectiveness hinges on the degree of integration into frontline operations and on employee engagement with these tools. When properly aligned, digital innovation reduces wait times, minimizes order errors, and enables real-time customer interaction, thereby bolstering customer loyalty and retention.
The fast-casual restaurant industry in Metro Manila has witnessed significant growth, driven by urbanization, rising disposable income, and evolving consumer preferences for convenient dining options. This segment—characterized by a balance between quick-service and higher-quality food offerings—operates in an increasingly competitive, digitally focused market landscape. Prominent brands such as Shakey’s Pizza, Kenny Rogers Roasters, Tokyo Tokyo, Yellow Cab Pizza Co., and BonChon Chicken have adopted a range of digital solutions, including online ordering platforms, mobile applications, third-party delivery integrations, contactless payments, data analytics, and loyalty program automation. These digital initiatives aim to optimize operational efficiency, enhance customer convenience, and solidify competitive positioning. The implementation of such technologies is further reinforced by Republic Act No. 8792, which institutionalizes electronic transactions and promotes digital business practices nationwide.
Challenges persist in consistently translating digital innovations into superior service quality. Service quality inconsistencies remain evident, particularly regarding responsiveness, complaint handling, and system reliability. For example, delays in online order processing, integration issues with delivery platforms, and inconsistent mobile app performance continue to hinder a seamless customer experience. Additionally, variability in employees' readiness and adaptation to digital systems contributes to fluctuations in service delivery standards. These practical challenges highlight critical research gaps, notably the insufficient understanding of how digital innovation affects service quality from the perspectives of multiple stakeholders—namely, managers, staff, and customers—within fast-casual restaurants in Metro Manila.
In recognition of this gap, the present study assesses the digital innovation practices of selected fast-casual restaurants in Metro Manila with respect to online ordering systems, mobile application features, integration with third-party delivery platforms, data analytics use, contactless payment solutions, and loyalty program automation. It likewise evaluates service quality in terms of responsiveness, reliability, tangibles, assurance, empathy, and complaint handling; identifies the problems encountered in relation to digital innovation and service quality; determines the relationship between digital innovation and service quality; examines the differences in the assessments of restaurant managers, staff, and customers; and evaluates the acceptability of the proposed Competitive Advantage Plan.
The findings of the study are expected to provide practical, evidence-based insights that will help fast-casual restaurants strengthen their digital capabilities, improve service quality, enhance customer satisfaction, and sustain competitive advantage in an increasingly digital and customer-oriented business environment.
Theoretical Framework
This study is anchored on two complementary theories that explain how digital technologies contribute to service excellence in the fast casual restaurant industry: the Technology Acceptance Model (TAM) developed by Fred D. Davis (1989) and the SERVQUAL Model developed by A. Parasuraman, Valarie A. Zeithaml, and Leonard L. Berry (1991).
The Technology Acceptance Model (TAM), introduced by Davis (1989), explains that an individual's intention to adopt and use a technology is primarily influenced by two key beliefs: perceived usefulness and perceived ease of use. Perceived usefulness refers to the extent to which users believe that a technology enhances their performance or experience, while perceived ease of use refers to the degree to which the technology is perceived as simple and effortless to operate. In the context of this study, digital innovations such as online ordering systems, mobile applications, contactless payment solutions, loyalty program automation, data analytics, and third-party delivery platform integration are more likely to be accepted and utilized when restaurant managers, staff, and customers recognize their benefits and find them convenient to use. As these technologies become integrated into restaurant operations, they contribute to improved operational efficiency, faster service delivery, greater customer convenience, and enhanced overall dining experiences. Thus, TAM provides an appropriate theoretical basis for explaining how technology acceptance supports the successful implementation of digital innovation in fast casual restaurants.
Complementing TAM, the SERVQUAL Model, developed by Parasuraman, Zeithaml, and Berry (1991), provides a well-established framework for measuring service quality across five dimensions: reliability, responsiveness, assurance, empathy, and tangibles. The model emphasizes that customers evaluate service quality by comparing their expectations with their actual service experiences across these dimensions. In fast-casual restaurants, where customer satisfaction and repeat patronage are essential for maintaining competitiveness, consistently delivering high-quality service remains a strategic priority even amid increasing digital transformation. The SERVQUAL Model is particularly relevant to this study because it enables the assessment of how digital innovation influences service performance in areas such as promptness in responding to customer requests, reliability of service delivery, employee competence, personalized customer care, physical facilities, and effective complaint handling.
By integrating the principles of SERVQUAL with digital innovation practices, the study recognizes that technological advancement alone is insufficient to achieve organizational success unless it is accompanied by excellent service delivery. Consequently, the combination of TAM and SERVQUAL provides a strong theoretical foundation for understanding how technology adoption and service quality collectively strengthen the competitive advantage of selected fast-casual restaurants in Metro Manila.
Conceptual Framework
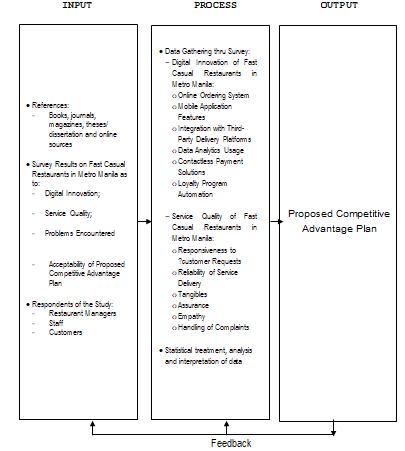
The study is anchored in the Input-Process-Output (IPO) Model, a widely used framework in research for systematically presenting the flow of information and the logical connections among the components of a study.
In the INPUT [I] box, the study draws on various references, including books, journals, magazines, theses, dissertations, and online sources, to support the literature review and conceptual understanding. The study's respondents include three key groups: restaurant managers, staff, and customers, who provide diverse perspectives on the practices and outcomes of digital innovation and service quality. The survey collects data on four major areas: the current state of digital innovation, service quality, the problems encountered in implementing and using digital services, and the acceptability of the proposed competitive advantage plan.
The PROCESS [P] box involves a series of steps beginning with data gathering through survey questionnaires. Digital innovation is assessed based on key features such as online ordering systems, mobile application features, integration with third-party delivery platforms, data analytics usage, contactless payment solutions, and loyalty program automation. Service quality is evaluated using dimensions like responsiveness to customer requests, reliability, tangibles, assurance, empathy, and complaint handling. The survey also gathers feedback on problems encountered in using or managing digital tools and services. After collecting the data, the researcher proceeds to analyze and interpret it, followed by presenting the findings to draw conclusions and insights.
The study's OUTPUT [O] box is the proposed Competitive Advantage Plan.
Statement of the Problem
This study aimed to assess the Digital Innovation and Service Quality of Selected Fast Casual Restaurants in Metro Manila as a basis for a competitive advantage plan.
Specifically, it sought to answer the following:
1. How do restaurant managers, staff, and customers assess the digital innovation of selected fast casual restaurants in terms of:
1.1. Online ordering system;
1.2. Mobile application features;
1.3. Integration with third-party delivery platforms;
1.1. Data analytics usage;
1.2. Contactless payment solutions; and
1.3. Loyalty program automation?
2. Is there a significant difference in the assessment of the three groups of respondents as to the aforementioned variables?
3. How do the respondents assess the service quality of selected fast casual restaurants as to:
1.1. Responsiveness to customer requests;
1.2. Reliability of service delivery;
1.3. Tangibles;
1.4. Assurance;
1.5. Empathy; and
1.6. Handling of complaints?
4. Is there a significant relationship between digital innovation and service quality of selected fast casual restaurants?
5. What are the problems encountered in terms of digital innovation and service quality?
6. Based on the findings, what competitive advantage plan may be proposed?
7. How acceptable is the proposed competitive advantage plan?
Hypotheses
This study hypothesized the following:
1. There is no significant difference among the assessments of the restaurant managers, staff and customers as to digital innovation of fast casual restaurants in Metro Manila such as: online ordering system, mobile application features, integration with third-party delivery platforms, data analytics usage, contactless payment solutions, and loyalty program automation; and
2. There is no significant relationship between digital innovation and service quality of selected fast casual restaurant in Metro Manila.
Scope and Limitation of the Study
This study focused on the digital innovation and service quality of selected fast casual restaurants in Metro Manila. Specifically, it investigated how restaurant managers, staff, and customers assessed digital innovation in areas such as online ordering systems, mobile application features, integration with third-party delivery platforms, data analytics usage, contactless payment solutions, and loyalty program automation, assessment of service quality through six dimensions: responsiveness to customer requests, reliability of service delivery, tangibles, assurance, empathy, and complaint handling, problems encountered relative to digital innovations and service quality, respondents of the study, and acceptability of a proposed competitive advantage plan.
The respondents of the study consisted of a total of 249 participants, including twelve (12) restaurant managers, seventy-four (74) staff members, and one hundred sixty-three (163) customers. These participants were selected to provide a comprehensive perspective on digital innovation and service quality from multiple stakeholder groups involved in restaurant operations and patronage.
The study was conducted in five selected fast casual restaurant branches located in Metro Manila: Shakey’s Pizza Restaurant, Kenny Rogers Roasters, Tokyo Tokyo, Yellow Cab Pizza Co., and BonChon Chicken, all situated within SM Manila. Data collection utilized both face-to-face and online survey methods to ensure accessibility and convenience for respondents across different locations and schedules. Physical surveys were distributed on-site to staff and dine-in customers, while online surveys were disseminated via email and social media platforms to reach off-duty staff and frequent customers who could not be reached physically.
The time frame of the study was from April 2025 to June 2026.
The study was delimited by its focus on selected fast casual restaurants within a specific geographic area (Metro Manila) and by targeting only certain stakeholder groups (managers, staff, and customers).
Significance of the Study
The findings of this study will be beneficial to the following:
Restaurant Managers. The study will help managers understand which digital tools work best and where improvements are needed. This will allow them to make better decisions to improve operations and meet customer expectations, helping their restaurants stay competitive.
Restaurant Staff. The results will guide managers in creating better training and support for staff. This will help employees use digital systems more effectively, work more efficiently, and provide better service.
Customers. Customers will enjoy faster ordering, easier payments, and more responsive service thanks to the improvements suggested by this study. This will make their dining experience more convenient and satisfying.
Restaurant Owners and Investors. The findings will help owners and investors decide which technology and service improvements are worth investing in. This can lead to better customer loyalty and higher profits.
Prospective Customers. Improvements in service and technology may attract new customers and improve how fast-casual restaurants are perceived in Metro Manila.
Future Researchers. This study will serve as a useful guide for researchers examining digital innovation and service quality in restaurants and similar industries. It can help shape future studies in business, hospitality, and technology.
Definition of Terms
The following terms used are hereby defined operationally and conceptually:
Assurance - Refers to employees' knowledge, courtesy, and ability to inspire trust and confidence. It includes competence, credibility, and security in the service process. (Parasuraman, Zeithaml, & Berry, as cited in Chen & Lin, 2021).
Contactless payment solutions – refer to digital tools such as QR codes, e-wallets, or tap-to-pay cards that allow customers to complete transactions without physical contact at fast-casual restaurants.
Customers – refer to individuals who have dined at or availed of services from the selected fast-casual restaurants in Metro Manila and participated in the survey.
Data analytics usage – Refers to the collection, processing, and interpretation of customer-related and operational data to inform strategic decisions. In restaurants, it is used to predict trends, monitor customer behavior, and personalize marketing. (Nguyen & Simkin, 2023).
Digital innovation - Refers to the integration of digital technologies in business models to enhance customer experience, streamline operations, and drive competitive advantage (Wang & Ahmed, 2022).
Empathy - the degree of caring and individualized attention the firm provides to its customers (Alzoubi et al., 2020).
Fast casual restaurants – dining establishments that offer higher-quality food than traditional fast food, with limited table service and moderately priced meals, often featuring customizable options and digital ordering capabilities (Kim & Park, 2021).
Handling of complaints - Refer to how restaurant staff manage and resolve customer issues or negative feedback during or after the service transaction.
Integration with third-party delivery platforms – refer to the restaurant’s connection to and operation with digital delivery partners such as GrabFood, Foodpanda, and other food delivery apps.
Loyalty program automation – Refers to the use of digital systems or applications that automatically track customer purchases and reward repeat visits or spending with points, discounts, or perks.
Mobile application features – Refer to the functions within a restaurant’s mobile app, such as browsing menus, placing orders, tracking deliveries, earning rewards, and accessing customer service.
Online ordering system – refer to a digital platform (website or app) that allows customers to place food orders remotely for pickup or delivery, streamlining the ordering process.
Problems encountered - Refers to the challenges reported by restaurant managers, staff, and customers in using or managing digital innovations and delivering or receiving quality service.
Proposed competitive advantage plan - Refers to the strategic plan developed as an output of the study, based on survey findings, aimed at helping fast casual restaurants gain a sustainable edge in the market.
Reliability of service delivery - Refers to the ability of the service provider to perform the promised service dependably and accurately (Parasuraman et al., as cited in Lin & Lin, 2020).
Restaurant managers – individuals responsible for overseeing operations, digital implementation, and customer service strategies in the selected fast-casual restaurants.
Responsiveness to customer requests - the willingness to help customers and provide prompt service (Chen & Lin, 2021).
Service quality - refers to the overall assessment of a service by the customer, determined by expectations and perceptions across dimensions such as reliability, assurance, tangibles, empathy, and responsiveness (Alzoubi et al., 2020).
Staff refers to the service crew and employees working under restaurant operations who interact with customers and utilize digital tools in service delivery.
Tangibles refers to the physical facilities, equipment, personnel appearance, and communication materials that influence customers’ service perceptions (Nguyen & Simkin, 2023).
Review of Related Literature and Studies
Local Literature
Digital innovation strategies posits that advanced technology deployment serves as a mandatory tool for aligning business workflows with the expectations of the contemporary Filipino consumer demographic. Fast-casual dining establishments must continually integrate systems such as mobile wallets and online ordering platforms to improve front-end execution metrics. This operational evolution serves as an existential requirement rather than an optional upgrade in highly competitive local urban hubs. By standardizing these customer-facing touchpoints, restaurants can improve transactional speed and overall responsiveness. Ultimately, these targeted adjustments enable management to cultivate trust and retain market relevance in dynamic commerce zones (Cruz, 2023).
According to Mangahas (2022), specialized applications have evolved into an indispensable bridge linking brand aesthetics to immediate transactional capabilities in the Philippine foodservice market. Digital features such as automated reward platforms and real-time processing updates are fundamentally designed to build emotional ties with consumers. This high-touch interactive environment directly encourages repeat patronage while optimizing the customer journey across multiple touchpoints. Casual dining operators are therefore compelled to maximize the simplicity of the user interface to sustain consumer engagement. Consequently, mobile application integration transforms transactional portals into highly effective avenues for long-term customer retention.
Similarly, the Bangko Sentral ng Pilipinas (2022) sets forth a structured operational framework under Circular No. 1157 to govern electronic fund transactions and standard payment networks nationwide. This comprehensive regulatory policy serves as the mandatory baseline ensuring that digital marketplace operations maintain high transactional integrity. Local restaurants and service enterprises are required to configure their point-of-sale systems to meet these central bank safety requirements. By standardizing these financial protocols, the state provides an architecture that mitigates payment friction and builds public confidence. Thus, aligning corporate technology with this macro policy remains essential for legitimate digital payment deployment.
Meanwhile, the Department of Information and Communications Technology (2023) outlines systemic data protection requirements through the official National Cybersecurity Plan 2022–2027. This broad operational blueprint addresses critical vulnerabilities in modern corporate digital expansions and cloud storage networks. Service operators utilizing online customer records must strictly align their back-end environments with these state-level digital defense paradigms. Minimizing cyber risks ensures that proprietary transactional nodes remain well-protected against systemic breaches. Accordingly, this national strategy provides businesses with the exact technical guidelines required to foster digital safety and operational longevity.
Likewise, the Department of Trade and Industry (2022) maps the strategic operational milestones necessary to expand domestic digital marketplaces via the Philippine E-Commerce Roadmap 2022–2025. This industrial publication establishes institutional targets regarding digital network readiness and cross-sector technology adoptions. Foodservice operators and retail networks are encouraged to aggressively digitize their supply chains and point-of-sale systems to capture market opportunities. Building this collaborative technical environment prepares local establishments to comfortably service highly connected urban consumers. Ultimately, this foundational roadmap serves as a blueprint for standardizing corporate technological modernization programs.
According to the Department of Trade and Industry (2023), the structural guidelines in the revised edition of the e-commerce roadmap emphasize transaction trust metrics. This policy framework asserts that modern corporate digital environments must transparently protect consumer financial records to encourage long-term economic participation. Restaurant management teams must verify that their digital payment solutions maintain maximum encryption and low system downtime. Eliminating electronic terminal errors satisfies both state guidelines and consumer safety expectations simultaneously. Therefore, adhering to this revised trade plan allows establishments to build deep brand equity anchored on verified structural credibility.
Further, the National Economic and Development Authority (2023) targets large-scale economic revitalization through the digital transformation strategies outlined in the Philippine Development Plan (PDP) 2023–2028. This comprehensive national blueprint mandates that workplace-wide technological implementations foster a shared operational understanding between corporate managers and rank-and-file employees. Disjointed software applications or partial technical transformations often create internal operational friction that undermines customer care delivery. Cultivating a uniform environment of technical readiness enables service firms to unlock the full potential of their front-end platforms. Consequently, this state plan anchors commercial growth on collective technological proficiency.
Also, National Privacy Commission (2023) enforces rigid transactional data confidentiality standards through the updated Implementing Rules and Regulations of the Data Privacy Act of 2012. This crucial regulatory framework establishes that any organization that captures customer information must guarantee absolute privacy rights and maintain secure storage networks. Casual dining establishments that use mobile features or digital loyalty systems have a legal obligation to protect consumers' identities from data leaks. Restricting unverified third-party access to internal financial databases serves as a primary pillar of modern corporate assurance. As a result, this regulatory mandate ensures that local digital growth does not compromise baseline customer privacy protections.
Furthermore, Republic Act No. 11032 (2018), the Ease of Doing Business and Efficient Government Service Delivery Act, provides a powerful statutory mandate to eliminate friction in manual systems. This national law heavily influences public service expectations by establishing rapid transaction processing as a baseline norm. Corporate organizations must systematically re-engineer their internal workflows to eliminate bureaucratic delays and front-of-house bottlenecking. Aligning service turnaround times with this legislative standard naturally results in heightened efficiency and reduced consumer irritation. Hence, this statutory paradigm compels service industries to prioritize rapid, error-free transaction workflows.
Foreign Literature
According to Parasuraman (2020), customer perceptions of organizational excellence are primarily anchored in baseline trust and structural safety metrics before speed factors come into play. Service operators who prioritize rapid transaction turnover at the absolute expense of security often suffer severe damage to customer relationships. A firm must establish procedural reliability and secure its payment systems to foster genuine customer confidence. Once this bedrock of organizational trust is stabilized, secondary efficiency characteristics can be integrated to optimize market performance. Therefore, strategic management models must construct a reliable service ecosystem before accelerating operational velocities.
Similarly, Venkatesh (2021) noted that intuitive system design and effortless interaction paradigms are the primary drivers of sustained user engagement. Complex digital tools that confuse front-line operating staff or final consumers inevitably trigger high system rejection rates. Modern service architectures must prioritize interface clarity to enable seamless, everyday use of technology in fast-paced commercial environments. When an organization reduces the cognitive load required to operate a service application, consumer satisfaction naturally rises. This conceptual literature establishes that software simplicity remains a primary prerequisite for executing successful enterprise digital integrations.
As mentioned, Smith (2021) discusses the international business trend toward standardizing front-end digital transactional tools to achieve rapid commercial expansion. Fast-casual establishments worldwide consistently secure competitive advantages by deploying uniform online payment gateways and structured ordering configurations. Prioritizing these consumer-facing portals enables international service firms to mitigate local workforce constraints and minimize peak-hour floor traffic congestion. This operational model transforms digital customer touchpoints into highly scalable revenue-generating pathways. Thus, this global overview indicates that front-end interface standardization is a mandatory baseline for modern corporate growth.
As mentioned, Schneider (2022) emphasizes that the perceived quality of modern service environments depends heavily on balancing physical spatial conditions with functional digital assets. Incorporating advanced self-order kiosks or digital displays does not yield positive customer assessments if the surrounding floor layout causes employee collisions or customer confusion. Physical environment cleanliness and intuitive paths remain essential prerequisites for maintaining operational efficiency under high-volume pressure. Technological tools must be positioned in context to augment the physical workflow rather than clutter the customer service arena. Therefore, design models must treat physical layout and digital hardware as a singular unified ecosystem.
Meanwhile, Laudon (2023) explains in Management Information Systems that contemporary data analytics tools serve as the core engine for maximizing operational intelligence and improving management choices. Modern business analytics allow firms to monitor consumer habits, fine-tune pricing mechanisms, and optimize inventory pipelines with absolute statistical precision. Operating an enterprise without data-driven tracking architectures places the organization at a severe competitive disadvantage in fast-paced service markets. Management must utilize integrated information systems to transform raw transactional data into structured strategic decisions. Thus, this classic textbook frames business intelligence as a premier requirement for modern corporate administration.
According to Evans (2023), system reliability within digital-first dining environments forms the absolute bedrock of customer retention and brand equity. When an ordering platform consistently eliminates processing errors and maintains strict time predictability, consumer trust rises naturally. Technical inconsistencies or structural order inaccuracies rapidly destroy an organization's credibility, regardless of its initial marketing appeal. Management must invest heavily in stabilizing its technical infrastructure to secure long-term consumer assurance. In short, this theoretical text demonstrates that flawless system reliability is the primary pillar of digital consumer loyalty.
Kwon (2023) identifies secure operational settings as the most vital driver of consumer assurance and brand trust across modern service industries. Customers require clear evidence that their digital transactions and private profiles are fully protected against data vulnerabilities. Service networks that experience frequent security hesitations or terminal breakdowns risk immediate customer defection to more stable competitors. Corporate leaders must implement rigorous security protocols to project unwavering operational integrity. Therefore, this conceptual literature establishes that structural safety is the absolute foundation upon which all modern transactional tools must sit.
According to Thomas (2023), the longevity of service relationships depends heavily on an organization’s emotional capacity to validate consumer grievances before deploying logistical fixes. When digital ordering systems or payment gateways fail, frontline employees must first utilize active listening to diffuse customer irritation. Rushing to apply mechanical solutions without addressing the consumer's immediate frustration often results in permanent damage to brand loyalty. Training personnel to execute empathetic, face-to-face service recovery is essential for protecting brand equity during tech breakdowns. Consequently, this communication literature frames psychological validation as the premier component of operational conflict resolution.
As mentioned by Carranza (2024), competitive advantage is a direct outcome of successful digital-human structural harmony across fast-casual operations. True operational efficiency is achieved only when an organization’s software infrastructure aligns with both executive strategies and employees' operational realities. Deploying complex applications that clash with the physical capabilities of the workforce results in immediate system failure and internal friction. Strategic plans must systematically bridge the gap between back-of-house technical readiness and front-of-house consumer interactions. In summary, this conceptual text demonstrates that sustainable growth requires complete operational balance between software assets and human personnel.
According to Schallmo & Williams (2024), who assert in Digital Transformation Frameworks that modern service firms must specialize in the deliberate augmentation of manual human operations through automated technological workflows. Automated solutions should handle repetitive checkout procedures and inventory tracking tasks to reduce human error metrics. Simultaneously, human workers must be strategically positioned to manage complex customer care exceptions that software cannot resolve. This dual-layered framework optimizes operational velocity while preserving the crucial human touch points of hospitality. Ultimately, this handbook provides management teams with a clear roadmap for balancing automation with human capital.
Lastly, Anderson (2024) stated that strategic plans targeting market dominance are accepted by stakeholders only when they maintain absolute practicality and clear financial viability. Executive teams must verify that proposed technological modifications directly address current market trends and real-world customer friction points. Plans that demand substantial financial capital without offering measurable improvements in service-quality parameters are routinely rejected by internal staff. Strategy formulation must remain anchored on realistic execution capabilities to secure uniform corporate commitment. Therefore, this planning literature notes that practical responsiveness is the premier trait of an effective business roadmap.
Local Studies
As mentioned, Delos Santos (2020) performed a descriptive-quantitative survey investigating the operational metrics of web-based ordering adoptions among selected fast-casual dining establishments across Metro Manila. The gathered data statistically demonstrated that modern digital platform rollouts successfully minimize front-of-house bottlenecks while meeting consumer convenience benchmarks. However, the study identified significant operational strains in backend order-tracking accuracy during high-volume periods. Establishments running non-integrated software portals scored lower on overall operational efficiency indexes. Therefore, the researchers concluded that the responsive deployment of web-based front-end configurations is a primary driver of long-term consumer transaction satisfaction in urban Philippine commercial centers.
Meanwhile, Ramos (2021) conducted a data-driven field investigation to track the operational workflows of independent food delivery application linkages operating within Quezon City. The empirical evidence highlighted a substantial expansion in total off-premise sales volumes directly attributable to aggregate digital application platforms. Nevertheless, the quantitative data exposed immediate operational strains surrounding manual rider coordination loops and real-time product profile updates. Casual dining managers without automated inventory hubs faced frequent order cancellations and severe fulfillment errors. Consequently, the study concluded that third-party digital delivery platform integrations require robust internal software controls and automated menu synchronization protocols to effectively maintain organizational service reliability.
On the other hand, Cruz (2021) conducted a study that collected quantitative data from fast-casual dining customers in select Metro Manila commercial centers to evaluate the adoption of electronic payments. The statistical outcomes demonstrated that the integration of modern digital checkout pathways significantly improves table turnover and counter-level processing speeds. However, the gathered data uncovered widespread consumer hesitation regarding point-of-sale data privacy vulnerabilities and hardware processing lag during final bill settlements. These localized security fears frequently prompt tech-savvy customer groups to revert to cash handoffs at the absolute expense of digital innovation features. In short, the investigator reached the definitive conclusion that maximizing digital payment efficiency requires firms to actively minimize platform security concerns to secure sustained consumer adoption.
Likewise, Santiago (2022) conducted a study tracking trends in data analytics utilization across several prominent chain restaurant networks operating in Metro Manila. The statistical findings confirmed that processing real-time consumer-tracking metrics dramatically improves corporate pricing adjustments and targeted menu positioning. Interestingly, these distinct strategic management advantages were realized despite back-of-house inventory systems remaining structurally immature. Local management teams successfully leveraged standalone data nodes to eliminate administrative guesswork during high-pressure market shifts. Hence, the study concluded that modern business analytics software is an essential strategic engine that can drive immediate improvements in corporate performance, even within partially digitized business structures.
Similarly, Tan (2022) conducted a data-driven survey to track consumer interaction loops, point-tracking systems, and digital enrollment tools in the Metro Manila fast-casual sector. The statistical findings indicated that while automated rewards applications optimize initial transaction velocities, converting these touchpoints into genuine customer commitment requires a holistic approach. Local consumers routinely abandon specialized loyalty software if the promotional program fails to match the physical quality of the dining experience. Management must verify that automated incentives are consistently backed by exceptional front-of-house hospitality frameworks. In summary, the researcher concluded that automated loyalty-tracking architectures yield sustainable competitive advantages only when paired with high physical service quality.
Also, Bautista (2022) conducted a study in casual dining environments in the Philippines to identify the specific drivers of long-term consumer retention. While advanced technology upgrades streamline the initial phases of the ordering journey, the data proved that an establishment's concrete physical capability to eliminate errors determines its true reliability score. Consumers consistently link service excellence to time predictability and order accuracy during peak-hour foot-traffic strain. The study noted that digital updates lose their psychological value the moment a consumer receives an inaccurate order. Ultimately, the field investigation concluded that absolute order accuracy and tight operational synchronization between kitchen lines and digital queues represent the primary pillars of domestic service quality.
Likewise, Santos (2022) conducted a localized service quality analysis across selected Metro Manila restaurants to measure the direct correlation between workforce training investments and customer assurance. The empirical field data indicated that while advanced digital kiosks and physical protocols boost initial brand trust, employees must be able to accurately explain evolving menu details to dining guests. Frontline workers who struggle to navigate updated terminal interfaces create immediate transactional bottlenecks that irritate tech-savvy consumers. The study verified that continuous investments in ongoing digital and soft-skills training directly correlate with higher customer assurance marks. Hence, the research concluded that modern technological deployments require matching human capital investments to prevent severe operational execution failures.
Similarly, Navarro (2022) conducted a study on Philippine quick-casual businesses assessing compliance with statutory structural accommodations for seniors and PWDs against frontline emotional labor strains. The data reveals that while physical infrastructure modifications are well-regarded and legally enforced across Metro Manila, intense peak-hour operational pressures heavily strain staff patience. Frontline personnel frequently struggle to maintain empathetic service quality standards when balancing high-volume digital queues with high-touch physical care requests. The study emphasizes that local operators must implement ongoing soft-skills reinforcement to support their staff under intense operational strain. Thus, the researcher concluded that the execution of inclusive hospitality requires active management intervention and balanced workflow design to protect frontline staff from emotional exhaustion.
As discussed by Fernandez (2022), research on Manila’s casual dining sector tracks face-to-face problem-solving against systematic CRM follow-up behaviors. The findings indicate that while Filipino hospitality culture naturally excels at delivering empathetic, immediate fixes on the restaurant floor, casual food establishments frequently struggle to sustain structured digital follow-ups once the initial conflict is settled. This failure to record and analyze complaint data prevents local firms from identifying chronic operational bugs within their digital ordering platforms. Management must implement digital tracking systems to monitor complaint resolutions past the initial floor encounter. Therefore, the study concluded that protecting long-term customer relationships demands the systematic transition from manual floor patches to data-driven digital service recovery tracking.
Similarly, Reyes & Santos (2023) conducted a hospitality research study that validates structural platform satisfaction disparities between back-of-house operating staff and final consumers. The field data confirms that digital platform rollouts in domestic settings frequently generate friction because terminal interfaces are designed without consulting frontline workers. While customers praise the system's rapid service speed, operating staff report high stress due to complex terminal layouts and frequent system lag. This role-based divergence demonstrates that role-based interaction shapes how technological value is perceived in the workplace. Consequently, the study concluded that local strategic plans must prioritize interface usability to ensure smooth execution and consistent stakeholder acceptance.
Likewise, Alvarez (2023) conducted a study across key Philippine business districts, verifying the direct structural interdependence between high-performing digital frameworks and superior organizational service marks. The gathered data demonstrates that high-performing tech systems consistently yield superior service marks across all dimensions of responsiveness, reliability, and assurance. The study concludes that modern fast-casual business models can no longer separate operational quality from their digital infrastructure assets. Local operators using outdated, non-integrated software portals score significantly lower on customer retention indices. In conclusion, the research found that digital transformation is the primary architectural force driving modern local service excellence.
Meanwhile, Villanueva (2023) presented data-driven research analyzing casual dining networks to evaluate consumer friction metrics stemming from payment gateway instability. The statistical findings reveal that while local restaurant consumers are highly forgiving of minor app layout bugs, electronic payment failures generate immediate operational friction that pressures frontline staff. When a payment gateway experiences downtime, it directly interrupts the core transaction phase, leading to double-billing scares and delayed table turnovers. Frontline employees bear the brunt of customer irritation during these technical breakdowns. Ultimately, the study concluded that securing redundant payment networks and instant backup communication links is vital to protecting real-time service delivery.
Likewise, Aguirre (2024) presents a comprehensive study of the fast-casual restaurant ecosystem in Metro Manila, confirming that unwavering transactional trust ultimately secures brand equity. The empirical data indicate that while physical aesthetics and empathetic service recovery are highly prized by the local dining public, these elements fail to compensate for a fractured sense of security. When peak-hour foot traffic strains operational responsiveness, establishments that maintain transparent, error-free financial processing protect their market share. The study concludes that trust operates as the primary metric anchoring customer loyalty during periods of high operational stress. Hence, the research established the definitive conclusion that local strategic management plans must prioritize transaction safety over speed to preserve brand equity.
Finally, Lopez (2024) conducted a spatial and empirical field study of Metro Manila dining locations, demonstrating that physical cleanliness and floor layouts are necessary to prevent staff friction despite upgrades to self-order kiosks. The quantitative data reveal that installing advanced digital hardware in poorly planned dining spaces leads to severe bottlenecks near payment counters. Frontline employees face heightened operational confusion when physical customer flows conflict with digital queue structures. The study proves that maximizing customer satisfaction scores requires equal investment in spatial design and software updates. Therefore, the investigator concluded that the optimization of modern digital innovations remains fundamentally dependent on the upkeep of traditional physical tangibles.
Foreign Studies
In the study by Lemon & Verhoef (2021), an advanced conceptual marketing framework is presented that prioritizes the systematic tracking of consumer touchpoints across the entire service experience. A successful digital transition relies entirely on an organization’s structural capability to match consumer expectations for accessibility at every stage. Any operational disconnect between initial digital ordering steps and final physical product fulfillment severely damages brand equity. Management must design continuous loops where mobile app tools seamlessly hand off tasks to physical operations staff. Ultimately, this marketing theory demonstrates that service excellence requires complete architectural harmony across all interactive nodes.
In Bharadwaj (2021), digital transformation is defined as an all-encompassing architectural force that fundamentally modernizes every metric of organizational service delivery. Integrating digital platforms alters how value is created, processed, and distributed to the final consumer. This comprehensive evolution forces traditional firms to re-engineer their legacy workflows to keep pace with modern digital ecosystems. Companies that delay these digital structural changes face rapid market obsolescence in highly competitive service industries. Therefore, this theoretical literature emphasizes that modern corporate sustainability is inextricably intertwined with the systemic adoption of technology.
Likewise, Vial (2023) outlines a conceptual operational framework stating that digital transformation must be viewed as an architectural force meant to support, rather than fully replace, human frontline touchpoints. Service firms that entirely automate their customer journeys often create cold, mechanical environments that alienate core consumer groups. Technological assets must be deployed to handle standard processing tasks, thereby freeing human workers to manage complex customer inquiries. This balanced configuration ensures that the human element of hospitality remains intact during high-volume periods. Hence, digital optimization succeeds when automation and human empathy are seamlessly blended.
In Patel (2022), modern contactless payment frameworks are framed as essential service modernization catalysts that drastically optimize counter-level velocity. Eliminating physical cash handoffs naturally reduces manual payment processing delays and improves overall table turnover. This conceptual overview positions electronic payment solutions as a structural requirement for any service firm operating in high-volume urban centers. However, the author stresses that sustained consumer adoption depends heavily on an enterprise's ability to minimize transaction failures. Service operators must consequently back their contactless hardware with strong processing links to ensure absolute system stability.
In the study by Chen (2022), data-driven journal research on digital food platforms demonstrated that well-integrated ordering tools successfully optimize transactional velocity and customer satisfaction metrics. The statistical analysis proves that minimizing manual entry points directly correlates with reduced order processing times and enhanced customer evaluations. Customers consistently award higher-quality ratings to platforms that offer clear navigation and seamless payment processing. The study examines how international service platforms achieve rapid market success by embedding technology that reduces user friction during the selection phase. In short, the researchers concluded that intuitive digital innovation directly optimizes transaction speed and service quality parameters within competitive global markets.
According to Alzoubi & Yanamandra (2022), data-driven research reveals that distinct functional roles strongly influence how the overall value and execution of an information system are perceived. Executive management teams frequently evaluate digital platform rollouts through the lens of strategic alignment and long-term financial returns. Conversely, front-line employees judge identical systems based on terminal interface usability, backend stability, and daily operational friction. Meanwhile, final consumers remain focused entirely on the speed, convenience, and security of their individual checkout journeys. Bridging these distinct experiential gaps requires organizations to deploy multi-dimensional training programs and balanced user designs.
Furthermore, Kim (2020) conducted a journal article study using quantitative analysis to examine digital complaint management challenges across fast-casual restaurants in South Korea. The field data demonstrated that when automated applications encounter software glitches, the efficiency of the subsequent service recovery path determines the survival of the customer relationship. Delayed problem resolution and confusing interface navigation during transaction crises drastically accelerate customer defection rates to competing brands. Frontline staff must be equipped with immediate override protocols to handle platform failures face-to-face. As a result, the researcher concluded that digital service operations must embed real-time human-intervention backups into their software frameworks to protect consumer loyalty during systemic failures.
Also, Bianchi (2021) conducted a data-driven field investigation to evaluate the correlation between highly interactive mobile food-ordering networks and customer retention indices in the Italian urban hospitality market. The statistical models showed that platforms integrating immersive touchpoints—such as visually customized order builders and real-time delivery maps—consistently achieve higher consumer engagement metrics. However, the study found that user retention scores decline sharply when the underlying software experiences frequent gateway crashes during peak hours. Ensuring persistent backend system stability remains a mandatory prerequisite for protecting the commercial utility of mobile investments. In conclusion, the research established that interactive smartphone architectures function as effective brand stabilizers only when supported by rigid interface uptime baselines.
Likewise, Johnson (2022) published a comparative empirical study tracking mobile application utility and consumer friction points across fast-casual dining sectors in several developed Western economies. The gathered data indicated that while international consumers highly prioritize transaction velocity during digital collections, their overall quality assessments are heavily anchored on ordering accuracy. Establishing strict software quality assurance routines is an essential requirement for service operators seeking to reach broad consumer segments. Systemic order-mapping deviations or payment-terminal failures immediately prompt customers to take defection paths. Ultimately, the investigator concluded that standardizing international front-end applications requires simultaneous, comprehensive backend supply chain automation to secure high satisfaction metrics.
Further, Chen (2023) directed an investigation evaluating the deployment of advanced predictive analytics tools across a multi-location fast-casual restaurant enterprise. The statistical tracking models revealed that processing live sales profiles and consumer queue data allows store management to forecast inventory requirements with immense statistical precision. These data-driven frameworks successfully eliminated product waste indices while maximizing peak-hour order processing velocities across testing nodes. However, the study confirmed that data analytics setups achieve peak strategic value when local frontline staff are trained to act immediately on real-time interface alerts. Therefore, the researcher concluded that data analytics engines directly drive operational excellence by converting historical consumer actions into structured, daily management decisions.
Similarly, Kim & Lee (2023) conducted a quantitative field survey to measure the direct link between user-centric mobile features and customer retention metrics among chain restaurants in South Korea. The statistical outcomes showed that automated loyalty tracking, stored profile quick-checkouts, and personalized reward coupons significantly boost long-term customer life-cycle value. Despite these clear strategic advantages, the researchers observed that consumers express immediate frustration when applications update frequently without clear navigation adjustments. Management must enforce strict software deployment protocols to prevent user fatigue caused by shifting interface designs. In short, the study officially concluded that specialized mobile features secure exceptional consumer brand loyalty only when the system maintains long-term structural consistency.
As mentioned, Anderson (2024) managed a large-scale data-driven journal study exploring the operational integration of third-party aggregate delivery services across the North American restaurant sector. The empirical findings demonstrated that while third-party partnerships expand an establishment's market reach, they also impose severe logistical strain due to manual order re-entry and courier arrival mismatches. Restaurants that used automated intermediary software hubs to sync aggregate channels with internal point-of-sale systems recorded substantially fewer fulfillment errors. Managers who ignore these digital coordination touchpoints suffer immediate damage to brand equity due to extended delivery delays. Consequently, the research concluded that third-party platform integration requires strict, automated operational controls to ensure service reliability.
Likewise, Carranza (2024) conducted a multi-firm empirical investigation to map the structural alignment between digital innovations and frontline human capital across fast-casual dining networks. The statistical evidence showed that true operational efficiency is maximized only when software infrastructure matches the workforce's daily physical capabilities. Companies that deploy complex terminal architectures without providing extensive frontline training suffer immediate execution failures and heightened staff friction. Strategic management plans must treat advanced technological tools as support loops meant to augment, rather than fully replace, frontline human care. Ultimately, the data-driven study concluded that establishing deep digital-human structural harmony is the primary prerequisite for securing a sustainable commercial competitive advantage.
According to Kim & Lee (2024), the study analyzes the combined influence of the physical environment, tangibles, and digital app touchpoints on modern consumer satisfaction. The statistical results indicated that high-technology assets fail to elevate brand equity if the physical dining environment suffers from poor cleanliness or layout bottlenecks. Customers evaluate the modern dining journey as a single, fully integrated space where physical order pickup cleanliness must match digital checkout ease. Establishments that heavily prioritize mobile software while neglecting counter-level physical upkeep score significantly lower on customer assurance scales. Hence, the study concluded that optimizing service quality requires equal strategic investment in software updates and traditional physical tangibles.
As David (2022) asserts in Strategic Management: Concepts and Cases, securing a sustainable competitive advantage requires firms to align long-term corporate visions with day-to-day employee capabilities. Any proposed operational plan must undergo rigorous feasibility testing to verify its financial viability and market responsiveness before wide-scale deployment. Strategic plans that ignore the actual technical readiness of frontline staff inevitably suffer from execution failures. Management must cultivate internal structural harmony in which advanced digital assets directly support the workforce's manual operations. Ultimately, this textbook establishes that corporate excellence is achieved by linking technology, human capital, and sound financial planning.
In the study, Gartner (2022) provides an industry-wide market evaluation confirming that point-of-sale payment gateway disruptions carry an outsized negative impact on customer experience metrics. Because these technical failures occur at the definitive transaction phase, they instantly trigger severe front-of-house friction and crush employee morale. Frontline operations staff face immediate emotional labor strains when payment terminals fail to process customer transactions smoothly. Enterprises must establish robust backup networks and real-time technical fail-safes to protect their workflows from these operational breakdowns. Consequently, this corporate report highlights that the stability of electronic transactions is vital to ensuring real-time service delivery.
As stated by Gibson (2023), empathy-driven service architectures significantly elevate customer satisfaction scores when physical spaces and employee interactions adapt to diverse consumer groups. Modern technology interfaces must feature accessible configurations to ensure that vulnerable demographics can utilize digital touchpoints without friction. Frontline staff must complement these digital assets by demonstrating patience and proactive care during peak operational hours. Neglecting the emotional labor required to maintain inclusive hospitality results in cold and uninviting service spaces. Ultimately, this framework establishes that true service quality is defined by an organization's collective capacity for empathetic execution.
Likewise, Al-Emran & Granić (2022) reviewed the theoretical mechanics of automated loyalty architectures and personalized user analytics within modernized service environments. The authors argue that automated point tracking and simple digital enrollment procedures yield clear transactional advantages by eliminating system friction. When an establishment leverages data-driven consumer tracking, it can easily distribute customized incentives that maximize customer retention. However, transforming these digital interactions into authentic brand commitment requires a holistic operational strategy. Hence, automated loyalty systems achieve maximum utility only when paired with high levels of physical dining satisfaction.
Lastly, Kumar (2024) conducted a study tracking the deployment of artificial intelligence-driven menu recommendation systems and automated loyalty loops within the fast-casual restaurant industry of urban India. The gathered field data confirmed that AI algorithms processing past purchasing habits generate highly accurate cross-selling suggestions, thereby raising average transaction values. However, the research found widespread consumer hesitation about the handling of private financial records and data-tracking permissions in smartphone applications. Management must integrate transparent data security certificates into their user interfaces to maintain absolute user trust. In conclusion, the data-driven journal article concluded that automated personalization tools optimize corporate retention marks only when paired with visible, robust data privacy protections.
Synthesis
Regarding digital innovation strategies and mobile interface functionalities, a strong consensus exists across conceptual frameworks and empirical data, demonstrating that intuitive front-end configurations are mandatory tools for optimizing transactional velocity and consumer satisfaction. Cruz (2023) and Mangahas (2022) establish that integrating mobile wallets, specialized applications, and online ordering networks is an existential requirement to align workflows with the tech-savvy Filipino consumer base, transforming standard transaction portals into interactive avenues for emotional engagement and repeat patronage. This conceptual premise is heavily supported by the quantitative field data of Delos Santos (2020) and Ramos (2021), whose local investigations across Metro Manila and Quezon City statistically confirm that responsive web-based layouts and third-party delivery connections successfully eliminate front-of-house bottlenecking and drive off-premise sales volumes, though they introduce immediate backend synchronization challenges. On the international scale, the empirical findings of Chen, Zhang, & Lee (2022), Bianchi (2021), and Johnson (2022) validate these localized trends by proving that minimizing manual user touchpoints directly reduces processing times and boosts international satisfaction scores. However, these global studies show sharp declines in consumer evaluations when the underlying application experiences frequent interface update delays, payment terminal errors, or order mapping deviations during high-volume periods.
The intersection of state-level policy-mandated blueprints, macroeconomic goals, and corporate information security requirements requires service enterprises to build standardized technological environments that insulate consumer records from structural vulnerabilities. Bangko Sentral ng Pilipinas (2022) via Circular No. 1157, the Department of Information and Communications Technology (2023) through the National Cybersecurity Plan 2022–2027, and the National Privacy Commission (2023) collectively institute rigid legal baselines that command local retail and foodservice operations to lock down cloud storage setups and restrict unverified third-party database access. These strict confidentiality protections are conceptually and operationally intertwined with National Economic and Development Authority (2023) mandates in the Philippine Development Plan 2023–2028 and the statutory parameters of Republic Act No. 11032 (2018) and Republic Act No. 11967 (2023), which enforce rapid transaction velocities, eliminate manual administrative guesswork, and penalize deceptive digital platforms. This multi-layered regulatory architecture directly dictates the parameters of domestic commercial readiness, forcing casual dining establishments to re-engineer their internal front-of-house workflows to protect customer data privacy rights while maximizing processing efficiency. Ultimately, these national blueprints provide organizations with the precise parameters needed to establish institutional compliance while cultivating broad public trust in competitive local business districts.
Methodology
Research Design
The study employed a descriptive research design to systematically examine the existing conditions and perceptions of digital innovation and service quality among selected fast-casual restaurants in Metro Manila. Descriptive research is appropriate for studies that seek to describe characteristics, behaviors, opinions, or relationships among variables as they naturally occur without manipulating the research environment. According to Creswell and Creswell (2023), descriptive research enables researchers to collect quantitative data through structured instruments to accurately describe the attitudes, practices, and characteristics of a particular population. Through this approach, the researcher can obtain factual and objective information that serves as the basis for analyzing current organizational conditions and stakeholder perceptions.
The use of a descriptive research design was appropriate for this study because it enabled the researcher to assess the extent of digital innovation practices and the level of service quality as perceived by restaurant managers, staff, and customers. Likewise, it facilitated the identification of problems encountered in implementing digital innovation and delivering quality service, as well as the assessment of the proposed Competitive Advantage Plan's acceptability. Since the study also sought to determine significant differences among respondent groups and examine the relationship between digital innovation and service quality, the descriptive design provided a suitable framework for collecting reliable quantitative data using survey questionnaires and applying appropriate statistical analyses. Ultimately, the findings from this design provided an empirical basis for developing practical strategies to strengthen the competitive advantage of selected fast-casual restaurants in Metro Manila.
Population and Sampling
The study population comprised 449 respondents from selected fast-casual restaurants in Metro Manila, including restaurant managers, restaurant staff, and customers from five participating establishments: Shakey's Pizza Restaurant, Kenny Rogers Roasters, Tokyo Tokyo, Yellow Cab Pizza Co., and Bonchon Chicken. These respondent groups were selected because they possess first-hand knowledge and actual experience regarding the restaurants' digital innovation initiatives and service quality practices. Restaurant managers provided information on strategic and operational implementation, restaurant staff contributed insights into day-to-day service delivery and technology use, while customers evaluated their actual dining experiences and perceptions of digital services.
From the total population, 249 qualified respondents were selected as study participants: 12 restaurant managers, 74 restaurant staff, and 163 customers, as presented in Table 1. The study employed purposive sampling, a non-probability sampling technique in which respondents are deliberately selected based on predetermined qualifications relevant to the research objectives. According to Sekaran and Bougie (2021), purposive sampling is appropriate when researchers intentionally select participants who possess specific knowledge, experience, or characteristics necessary to obtain accurate and meaningful information about the phenomenon under investigation.
The use of purposive sampling was appropriate because not all individuals in the population had sufficient experience to provide reliable responses on digital innovation and service quality. Restaurant managers were included because they are directly involved in planning, supervising, and implementing digital initiatives and operational strategies. Restaurant staff were selected because they regularly utilize digital technologies and deliver services to customers. Customers, on the other hand, were selected based on their actual experience patronizing the selected fast-casual restaurants and using available digital service platforms, such as online ordering systems, mobile applications, digital payment facilities, and third-party delivery applications. By selecting respondents who had direct exposure to these practices, the study ensured that the information gathered was relevant, reliable, and aligned with the objectives of assessing digital innovation, evaluating service quality, identifying operational challenges, and formulating a Competitive Advantage Plan.
| Fast Casual Restaurants | Restaurant Managers | Staff | Customers | Total | ||||||||
| N | n | % | N | n | % | N | n | % | N | n | % | |
| Shakey’s Pizza Restaurant | 3 | 3 | 25.00 | 31 | 24 | 32.43 | 72 | 36 | 22.09 | 106 | 63 | 25.30 |
| Kenny Rogers Roasters | 2 | 2 | 16.67 | 23 | 11 | 14.86 | 56 | 28 | 17.18 | 81 | 41 | 16.47 |
| Tokyo Tokyo Restaurants | 2 | 2 | 16.67 | 21 | 15 | 20.27 | 60 | 30 | 18.40 | 83 | 47 | 18.88 |
| Yellow Cab Pizza Co. | 2 | 2 | 16.67 | 17 | 8 | 10.81 | 78 | 39 | 23.93 | 97 | 49 | 19.68 |
| Bonchon Chicken | 3 | 3 | 25.00 | 19 | 16 | 21.62 | 60 | 30 | 18.40 | 82 | 49 | 19.68 |
| Total | 12 | 12 | 100.00 | 111 | 74 | 100.00 | 326 | 163 | 100.00 | 449 | 249 | 100.00 |
Table 1 presents the distribution of the study population and sample across five selected fast-casual restaurants in Metro Manila, categorized by role as restaurant managers, staff, and customers. The total population comprised 449 individuals, with 12 managers, 111 staff members, and 326 customers. From this population, 249 respondents were sampled, including all 12 managers, 74 staff (approximately 67% of the total staff population), and 163 customers (about 50% of the total customer population). Sampling proportions varied across groups, with full inclusion of managers, substantial representation of staff, and a moderate share of customers. Among the restaurants, Shakey’s Pizza accounted for the largest share, with 106 individuals (24% of the total population) and 63 respondents (25% of the total sample), followed closely by Yellow Cab Pizza Co., with 97 individuals and 49 respondents. The other establishments, Kenny Rogers Roasters, Tokyo Tokyo, and Bonchon Chicken, had similar population distributions with slightly smaller sample sizes.
This distribution suggests that the study successfully captured comprehensive insights from multiple stakeholders across the fast-casual restaurant ecosystem. The full representation of managers ensures that strategic and operational perspectives on digital innovation and service delivery are fully documented. The substantial sampling of staff members allows for a solid understanding of frontline experiences and challenges related to technology adoption and service quality. Meanwhile, sampling half of the customer population provides a meaningful, though not exhaustive, view of customer perceptions and satisfaction. The reasonably balanced representation across the five restaurants supports comparative analysis and enhances the generalizability of the findings within the Metro Manila fast casual dining sector.
| Age (in years) | Restaurant Managers | Staff | Customers | Total | ||||
| f | % | f | % | f | % | f | % | |
| 51 years old and above | 1 | 1.35 | 5 | 3.07 | 6 | 2.41 | ||
| 41 – 50 years old | 7 | 58.33 | 3 | 4.05 | 25 | 15.34 | 35 | 14.06 |
| 31 – 40 years old | 5 | 41.67 | 24 | 32.43 | 48 | 29.45 | 77 | 30.92 |
| 21 – 30 years old | 42 | 56.76 | 67 | 41.10 | 109 | 43.78 | ||
| 20 years old and below | 4 | 5.41 | 18 | 11.04 | 22 | 8.84 | ||
| Total | 12 | 100.00 | 74 | 100.00 | 163 | 100.00 | 249 | 100.00 |
Table 2 manifests the distribution of respondents as to age such as: 109 or 43.78 percent are aged 21-30 years old, 77 or 30.92 percent are aged 31-40 years old, 35 or 14.06 percent are aged 41-50 years old, 22 or 8.84 percent are aged 20 years old and below, and 6 or 2.41 percent are aged 51 years old and above.
The age distribution indicates that the study is largely represented by respondents in the economically active and technologically adaptive age groups, particularly those aged 21–30 and 31–40 years. This suggests that the findings on digital innovation and service quality are primarily informed by individuals who are more likely to be familiar with and regularly utilize digital technologies in restaurant transactions, such as mobile ordering applications, contactless payment systems, and online delivery platforms. The presence of respondents from older age groups also provides additional perspectives, allowing the study to capture varying experiences and expectations across different generations. Consequently, age diversity enhances the credibility of the findings and supports the development of a Competitive Advantage Plan that addresses the preferences and service expectations of a broad customer and employee demographic in the fast-casual restaurant industry.
| Sex | Restaurant ]Managers | Staff | Customers | Total | ||||
| f | % | f | % | f | % | f | % | |
| Male | 4 | 33.33 | 40 | 54.05 | 67 | 41.10 | 111 | 44.58 |
| Female | 8 | 66.67 | 34 | 45.95 | 96 | 58.90 | 138 | 55.42 |
| Total | 12 | 100.00 | 74 | 100.00 | 163 | 100.00 | 249 | 100.00 |
Table 3 shows the distribution of respondents by gender, with 138 (55.42 percent) female and 111 (44.58 percent) male.
The distribution of respondents by sex indicates a relatively balanced representation of males and females, with a slightly higher proportion of females. This balanced composition enhances the study's comprehensiveness by incorporating diverse perspectives on digital innovation and service quality from both genders. Since consumer preferences, technology adoption, and service expectations may differ by sex, including both male and female respondents contributes to a more objective assessment of the study variables. Consequently, the findings are expected to provide a well-rounded understanding of stakeholders' perceptions, thereby supporting the formulation of a Competitive Advantage Plan that is responsive to the needs and expectations of a diverse customer base and workforce in the fast-casual restaurant industry.
| Civil Status | Restaurant Managers | Staff | Customers | Total | ||||
| f | % | f | % | f | % | f | % | |
| Single | 2 | 16.67 | 38 | 51.35 | 93 | 57.06 | 133 | 53.41 |
| Married | 10 | 83.33 | 36 | 48.65 | 69 | 42.33 | 115 | 46.18 |
| Widow/er | 1 | 0.61 | 1 | 0.40 | ||||
| Total | 12 | 100.00 | 74 | 100.00 | 163 | 100.00 | 249 | 100.00 |
Table 4 depicts the distribution of respondents by civil status: 133 (53.41 percent) are single, 115 (46.18 percent) are married, and 1 (0.40 percent) is a widower/widow.
The distribution of respondents by civil status reveals that the majority are single, followed by married individuals, while only a minimal proportion are widowed. This demographic composition suggests that the study primarily reflects the perceptions of individuals with varying lifestyle preferences, purchasing behaviors, and service expectations. Single respondents, who constitute the largest group, may demonstrate greater engagement with digital technologies and convenience-oriented services, whereas married respondents may offer insights informed by family-oriented dining experiences and service expectations. The inclusion of respondents with different civil statuses enriches the study by capturing a wider range of viewpoints, thereby strengthening the relevance of the findings for developing a Competitive Advantage Plan that accommodates the diverse characteristics and preferences of fast-casual restaurant customers and personnel.
| Educational Attainment | Restaurant Managers | Staff | Customers | Total | ||||
| f | % | f | % | f | % | f | % | |
| Doctorate Degree | 2 | 1.23 | 2 | 0.80 | ||||
| Doctorate with earned units | ||||||||
| Master’s Degree | 2 | 16.67 | 2 | 0.80 | ||||
| Masters with earned units | 1 | 8.33 | 7 | 9.46 | 12 | 7.36 | 20 | 8.03 |
| Bachelor’s Degree | 9 | 75.00 | 26 | 35.14 | 63 | 38.65 | 98 | 39.36 |
| Undergraduate | 41 | 55.41 | 86 | 52.76 | 127 | 51.00 | ||
| Total | 12 | 100.00 | 74 | 100.00 | 163 | 100.00 | 249 | 100.00 |
Table 5 displays the distribution of respondents by educational attainment: 127 (51.00 percent) are undergraduates; 98 (39.36 percent) have a bachelor’s degree; 20 (8.03 percent) have a master's degree with earned units; and 2 (0.80 percent) have both a master’s degree and a doctoral degree.
The distribution reveals that most respondents are undergraduates, followed by those with bachelor’s degrees, while only a small proportion have graduate-level education, indicating that the study’s findings are primarily shaped by respondents with undergraduate and bachelor’s educational backgrounds regarding digital innovation and service quality.
Research Instrument
The study utilized a researcher-made survey questionnaire as the primary data-gathering instrument. The questionnaire was carefully developed based on the research objectives, the variables identified in the conceptual framework, and the related literature and studies reviewed by the researcher. It was designed to gather reliable, relevant information from restaurant managers, restaurant staff, and customers on digital innovation, service quality, encountered problems, and the acceptability of the proposed Competitive Advantage Plan. The instrument underwent content validation by experts in business management and research to ensure its clarity, relevance, consistency, and adequacy in measuring the intended constructs. Comments and recommendations from the validators were carefully incorporated to improve the questionnaire's overall quality prior to its final administration.
The questionnaire consisted of five major parts to facilitate systematic data collection.
Part I. Gathered the demographic profile of the respondents, including age, sex, civil status, and educational attainment. These variables were included to describe the characteristics of the respondents and to provide a demographic context for interpreting the study's findings.
Part II. Assessment of Digital Innovation implemented by selected fast casual restaurants in Metro Manila. The indicators focused on online ordering systems, mobile application features, integration with third-party delivery platforms, data analytics utilization, contactless payment solutions, and loyalty program automation. These dimensions were intended to evaluate the extent to which restaurants adopted digital technologies to improve operational efficiency and enhance customer experience. This was used to answer the statement of problem number one.
Part III. Assessment of the Service Quality of the selected fast casual restaurants using indicators that examined responsiveness to customer requests, reliability of service delivery, tangibles, assurance, empathy, and complaint handling. These dimensions were included to assess the quality of services provided by the restaurants and to identify areas that contribute to customer satisfaction and organizational performance. This was used to answer the statement of problem number three.
Part IV. Identified the problems encountered in relation to digital innovation and service quality. This section enabled the respondents to assess the challenges experienced during the implementation of digital technologies and the delivery of restaurant services. The information gathered from this part served as the basis for identifying operational gaps and determining areas requiring improvement. This was used to answer the statement of problem number five.
Part V. Determined the acceptability of the proposed Competitive Advantage Plan. The respondents evaluated the proposed strategies based on their relevance, practicality, feasibility, and potential effectiveness in enhancing digital innovation and service quality at the selected fast-casual restaurants. The responses obtained from this section served as an important basis in validating the proposed plan before its recommendation for implementation. Overall, the researcher-developed questionnaire provided a comprehensive, valid, and reliable means of collecting the quantitative data necessary to achieve the study's objectives. This was used to answer the statement of problem number seven.
Data Gathering Procedures
The following steps were undertaken to gather relevant data for the study in a systematic and reliable manner:
1. Prepared and submitted permission letters to the management of the selected fast casual restaurants to request approval for data collection.
2. Distributed the validated survey questionnaires to restaurant managers, staff, and customers after approval was granted, with clear instructions provided.
3. Collected the completed questionnaires, checked them for completeness, and organized them for processing.
4. Tallied, tabulated, analyzed, and interpreted the data using appropriate statistical tools with the help of the adviser and statistician.
5. Presented the results in tabular and textual form.
Statistical Treatment of Data
The study applied the following statistical techniques:
1. Percentage was used to describe the profile of respondents by showing the proportion of each category in relation to the total population. According to Agresti (2021), a percentage is a basic descriptive tool used to express part-to-whole relationships in data.
Formula:
%=f / N x 100
Where:
f = frequencyN = total number of respondents
2. Weighted mean was used to determine the average assessment of respondents on digital innovation, service quality, problems encountered, and acceptability of the proposed plan. According to Triola (2021), it is used to compute averages when responses are weighted or assigned frequencies.
Formula:
wm = (w1f1 + w2f2 + ... + wnfn) / NWhere:
wm = weighted meanw = weight of each itemf = frequency of each responseN = total number of respondents
The Five-point Likert Scale was used to assess supervisors, reading coordinators, school heads, and teachers. The scales of statistical values adopted in this study were as follows:
2.1. For the Assessment on the Digital Innovation of Fast Casual Restaurants in Metro Manila
| Scale | Range | Verbal Interpretation | Symbol |
| 5 | 4.20 – 5.00 | Highly Evident | HE |
| 4 | 3.40 – 4.19 | Evident | E |
| 3 | 2.60 – 3.39 | Moderately Evident | ME |
| 2 | 1.80 – 2.59 | Least Evident | LE |
| 1 | 1.00 – 1.79 | Very Least Evident | VLE |
2.2. For the Assessment on the Service Quality of Fast Casual Restaurants in Metro Manila
| Scale | Range | Verbal Interpretation | Symbol |
| 5 | 4.20 – 5.00 | Excellent | E |
| 4 | 3.40 – 4.19 | Very Satisfactory | VS |
| 3 | 2.60 – 3.39 | Satisfactory | S |
| 2 | 1.80 – 2.59 | Fair | F |
| 1 | 1.00 – 1.79 | Poor | P |
2.3. For the Assessment on the Problems Encountered in Relation to the Digital Innovation and Service Quality of Selected Fast Casual Restaurants in Metro Manila
| Scale | Range | Verbal Interpretation | Symbol |
| 5 | 4.20 – 5.00 | Highly Encountered | HE |
| 4 | 3.40 – 4.19 | Encountered | E |
| 3 | 2.60 – 3.39 | Moderately Encountered | ME |
| 2 | 1.80 – 2.59 | Least Encountered | LE |
| 1 | 1.00 – 1.79 | Very Least Encountered | VLE |
2.4. For the Acceptability of the Proposed Competitive Advantage Plan
| Scale | Range | Verbal Interpretation | Symbol |
| 5 | 4.20 – 5.00 | Highly Acceptable | HA |
| 4 | 3.40 – 4.19 | Acceptable | A |
| 3 | 2.60 – 3.39 | Moderately Acceptable | MA |
| 2 | 1.80 – 2.59 | Least Acceptable | LA |
| 1 | 1.00 – 1.79 | Very Least Acceptable | VLA |
-
Analysis of Variance (ANOVA) was used to determine significant differences among the three groups of respondents. According to Hassan (2024), ANOVA compares the means of three or more groups to test if differences are significant.
Formula:
F = MSSb
MSSw
Where:
MSSb = Mean Sum of Squares Between
MSSw= Mean Sum of Squares Within
-
Pearson correlation was used to determine the relationship between digital innovation and service quality. According to Paguio et al. (2019), it measures the strength and direction of linear relationships between variables.
Formula:r = ΣXY / √(ΣX² ΣY²)Where:X = digital innovation scoresY = service quality scoresXY = product of X and Y
-
A t-test was used to determine whether the correlation between variables was significant. According to Paguio et al. (2019), it tests whether a correlation coefficient is significantly different from zero.
Formula:t = r√(n-2) / √(1-r²)Where:
t = computed valuer = correlation coefficientn = number of respondents
Formula:
Where:
t = computed valuer = correlation coefficientn = number of respondents
The critical t-value at 0.5 alpha (ɑ) with respective degrees of freedom was used to set the region of acceptance and rejection.
Guide in interpreting the Coefficient Correlation.
Range Verbal Interpretation Symbol
1.00 Perfect Correlation PC
0.80 – 0.99Very Strong Correlation VSC
0.60 – 0.79Strong Correlation SC
0.40 – 0.59 Moderate Correlation MC
0.20 – 0.39 Weak Correlation WC
0.01 – 0.19 Negligible Correlation NC
Presentation, Analysis, and Interpretation of Data
Sub-problem No. 1: How do the restaurant managers, staff, and customers assess the Digital Innovation of Selected Fast Casual Restaurants in terms of:
-
Online Ordering System
| Indicators | Restaurant Managers | Staff | Customers | Composite | Rank | ||||
| WM | VI | WM | VI | WM | VI | WM | VI | ||
| The restaurant’s online ordering system is easy to navigate and user-friendly. | 5.00 | HE | 4.64 | HE | 4.70 | HE | 4.78 | HE | 2 |
| Customers can easily customize their orders (e.g., add/remove ingredients, choose sizes). | 5.00 | HE | 4.57 | HE | 4.67 | HE | 4.75 | HE | 3 |
| The online ordering system provides accurate and updated menu information. | 5.00 | HE | 4.55 | HE | 4.56 | HE | 4.70 | HE | 5 |
| The system allows customers to track their orders in real time. | 4.92 | HE | 4.55 | HE | 4.61 | HE | 4.69 | HE | 6.5 |
| The restaurant’s online platform is reliable and rarely experiences technical issues. | 5.00 | HE | 4.59 | HE | 4.48 | HE | 4.69 | HE | 6.5 |
| Customers receive timely notifications and confirmations for their online orders. | 5.00 | HE | 4.66 | HE | 4.46 | HE | 4.71 | HE | 4 |
| The online ordering process reduces waiting time and enhances customer convenience. | 5.00 | HE | 4.65 | HE | 4.72 | HE | 4.79 | HE | 1 |
| Overall Weighted Mean | 4.99 | HE | 4.60 | HE | 4.60 | HE | 4.73 | HE |
Legend:
Range Scale Verbal Interpretation Symbol
54.20-5.00Highly Evident HE
43.40-4.19Evident E
32.60-3.39Moderately Evident ME
21.80-2.59Least Evident LE
11.00-1.79Very Least Evident VLE
As presented in Table 6, the assessment of digital innovation as to the online ordering system is rated as Highly Evident with an overall weighted mean of 4.73. All items rated as Highly Evident, namely: the online ordering process reduces waiting time and enhances customer convenience with a composite weighted mean of 4.79 as rank 1; the restaurant’s online ordering system is easy to navigate and user-friendly with a composite weighted mean of 4.78 as rank 2; customers can easily customize their orders (e.g., add/remove ingredients, choose sizes) with a composite weighted mean of 4.75 as rank 3; customers receive timely notifications and confirmations for their online orders with a composite weighted mean of 4.71 as rank 4; the online ordering system provides accurate and updated menu information with a composite weighted mean of 4.70 as rank 5; and the system allows customers to track their orders in real time; and the restaurant’s online platform is reliable and rarely experiences technical issues with both the composite weighted mean of 4.69 as rank 6 and 7.
As to assessments of the groups of respondents on digital innovation, the online ordering system was rated as Highly Evident by restaurant managers (overall weighted mean of 4.99) and by staff and customers (overall weighted mean of 4.60).
The exceptionally high rating for the online ordering system reveals that speed and ease of use are the most critical factors for modern restaurant consumers and workers. Because reducing wait time emerged as the top-ranked indicator, it is clear that digital tools provide the most value when they directly eliminate delays and speed up the service. Additionally, the near-perfect scores from restaurant managers indicate that management views a strong online platform as an essential operational asset for handling customer traffic and keeping daily service running smoothly.
The significance of these findings aligns closely with the perspectives offered by Chen et al. (2022), whose research on digital food platforms demonstrates that well-integrated ordering tools optimize transaction speeds and elevate overall customer satisfaction. In tandem with this, the insights established by Delos Santos (2020) mirror these results in the domestic landscape, confirming that the adoption of web-based ordering frameworks in Metro Manila's fast-casual sector is primarily driven by a shared desire among consumers and establishments to enhance service convenience and minimize manual processing delays.
1.2 Mobile App Features
| Indicators | Restaurant Managers | Staff | Customers | Composite | Rank | ||||
| WM | VI | WM | VI | WM | VI | WM | VI | ||
| The mobile app provides a smooth and intuitive user experience. | 4.92 | HE | 4.53 | HE | 4.63 | HE | 4.69 | HE | 1.5 |
| Customers can easily access promotions and discounts through the app. | 4.75 | HE | 4.59 | HE | 4.56 | HE | 4.63 | HE | 5 |
| The app allows for quick reordering of previous meals. | 5.00 | HE | 4.53 | HE | 4.53 | HE | 4.69 | HE | 1.5 |
| Push notifications effectively inform customers about new products/offers. | 5.00 | HE | 4.49 | HE | 4.54 | HE | 4.68 | HE | 3.5 |
| The mobile app integrates features like GPS location for nearby branches. | 4.83 | HE | 4.49 | HE | 4.46 | HE | 4.59 | HE | 7 |
| The app’s interface design is visually appealing and reflects the restaurant’s brand. | 5.00 | HE | 4.51 | HE | 4.53 | HE | 4.68 | HE | 3.5 |
| The mobile application loads quickly and performs well across different devices. | 4.83 | HE | 4.51 | HE | 4.49 | HE | 4.61 | HE | 6 |
| Overall Weighted Mean | 4.90 | HE | 4.52 | HE | 4.53 | HE | 4.65 | HE |
As shown in Table 7, the assessment of digital innovation regarding mobile app features is rated as Highly Evident, with an overall weighted mean of 4.65. All items rated as Highly Evident, these are: the mobile app provides smooth and intuitive user experience; and the app allows for quick reordering of previous meals with both the composite weighted mean of 4.69 as rank 1 and 2; push notifications effectively inform customers about new products/offers; and the app’s interface design is visually appealing and reflects the restaurant’s brand with both the composite weighted mean of 4.68 as rank 3 and 4; customers can easily access promotions and discounts through the app with a composite weighted mean of 4.63 as rank 5; the mobile application loads quickly and performs well across different devices with a composite weighted mean of 4.61 as rank 6; and the mobile app integrates features like GPS location for nearby branches with a composite weighted mean of 4.59 as rank 7.
As to assessments of the groups of respondents on digital innovation, mobile app features rated as Highly Evident were: restaurant managers (overall weighted mean of 4.90), customers (4.53), and staff (4.52).
The tied top rankings show that a mobile app works best when it is easy to navigate and lets customers reorder past meals with a single tap. Users prefer shortcuts over complicated designs because they save time and effort. At the same time, the high scores for visual layout and push notifications show that the app is a powerful marketing tool, helping the restaurant stay top of mind with customers.
The core focus on user convenience and interface simplicity is deeply rooted in the foundational concepts discussed by Venkatesh (2021), who asserts that system design and effortless technology acceptance are critical drivers of sustained user engagement in fast-paced service environments. This aligns with the reality of the domestic fast-casual marketplace, as Mangahas (2021) notes that mobile application features in Philippine casual dining settings serve as crucial touchpoints that elevate customer service by bridging the gap between brand aesthetic appeal and transactional speed.
1.3 Integration with Third-Party Delivery Platforms
| Indicators | Restaurant Managers | Staff | Customers | Composite | Rank | ||||
| WM | VI | WM | VI | WM | VI | WM | VI | ||
| The restaurant partners with reliable third-party delivery services (e.g., GrabFood, Foodpanda). | 4.75 | HE | 4.58 | HE | 4.77 | HE | 4.70 | HE | 1 |
| Orders placed through third-party platforms are processed accurately and promptly. | 4.42 | HE | 4.59 | HE | 4.67 | HE | 4.56 | HE | 6 |
| The menu items displayed on delivery apps are consistent with in-store offerings. | 4.67 | HE | 4.61 | HE | 4.60 | HE | 4.63 | HE | 4 |
| Delivery tracking via third-party platforms is accurate and up to date. | 4.67 | HE | 4.64 | HE | 4.47 | HE | 4.59 | HE | 5 |
| The restaurant maintains strong coordination with third-party delivery riders. | 4.50 | HE | 4.43 | HE | 4.40 | HE | 4.44 | HE | 7 |
| Customer complaints from third-party platforms are addressed efficiently. | 4.83 | HE | 4.53 | HE | 4.69 | HE | 4.68 | HE | 2 |
| The restaurant gains greater market reach through its third-party delivery partnerships. | 4.75 | HE | 4.55 | HE | 4.69 | HE | 4.66 | HE | 3 |
| Overall Weighted Mean | 4.66 | HE | 4.56 | HE | 4.61 | HE | 4.61 | HE |
As shown in Table 8, the assessment of digital innovation regarding integration with third-party delivery platforms is rated as Highly Evident, with an overall weighted mean of 4.61. All items rated as Highly Evident, such as: the restaurant partners with reliable third-party delivery services (e.g., GrabFood, Foodpanda) with a composite weighted mean of 4.70 as rank 1; customer complaints from third-party platforms are addressed efficiently with a composite weighted mean of 4.68 as rank 2; the restaurant gains greater market reach through its third-party delivery partnerships with a composite weighted mean of 4.66 as rank 3; the menu items displayed on delivery apps are consistent with in-store offerings with a composite weighted mean of 4.63 as rank 4; delivery tracking via third-party platforms is accurate and up to date with a composite weighted mean of 4.59 as rank 5; orders placed through third-party platforms are processed accurately and promptly with a composite weighted mean of 4.56 as rank 6; and the restaurant maintains strong coordination with third-party delivery riders with a composite weighted mean of 4.44 as rank 7.
As to assessments of the groups of respondents on digital innovation and its integration with third-party delivery platforms, rated as Highly Evident, these are: restaurant managers with an overall weighted mean of 4.66, customers with an overall weighted mean of 4.61, and staff with an overall weighted mean of 4.56.
The top ranking for partnering with reliable third-party networks indicates that a restaurant's digital presence relies heavily on the trust and operational strength of its delivery partners (such as GrabFood or Foodpanda). While gaining market reach and handling complaints scored highly, the lowest rank for coordination with delivery riders highlights a critical operational gap. This indicates that while the digital partnership successfully attracts external customers, maintaining real-time physical coordination with external delivery personnel remains the hardest part of the process to manage smoothly.
The strategic value and operational hurdles highlighted by these findings are well reflected in Ramos's (2021) study on food delivery integration in Quezon City, which confirms that while external applications drastically boost a restaurant's sales volume and customer base, the actual success of the system depends heavily on managing rider coordination and keeping menu updates aligned.
1.4 Data Analytics Usage
| Indicators | Restaurant Managers | Staff | Customers | Composite | Rank | ||||
| WM | VI | WM | VI | WM | VI | WM | VI | ||
| The restaurant uses customer data to understand dining preferences and behavior. | 4.75 | HE | 4.51 | HE | 4.53 | HE | 4.60 | HE | 2.33 |
| Data analytics help the restaurant optimize menu offerings and pricing strategies. | 4.83 | HE | 4.54 | HE | 4.56 | HE | 4.64 | HE | 1 |
| Sales data are regularly analyzed to improve operational performance. | 4.67 | HE | 4.54 | HE | 4.56 | HE | 4.59 | HE | 5 |
| The restaurant uses analytics to forecast demand and manage inventory effectively. | 4.58 | HE | 4.51 | HE | 4.51 | HE | 4.53 | HE | 7 |
| Marketing decisions are supported by insights drawn from customer data. | 4.58 | HE | 4.59 | HE | 4.50 | HE | 4.56 | HE | 6 |
| The restaurant uses data analytics to measure customer satisfaction and loyalty. | 4.83 | HE | 4.47 | HE | 4.49 | HE | 4.60 | HE | 2.33 |
| Management uses data-driven insights to enhance business decision-making. | 4.67 | HE | 4.61 | HE | 4.52 | HE | 4.60 | HE | 2.33 |
| Overall Weighted Mean | 4.70 | HE | 4.54 | HE | 4.52 | HE | 4.59 | HE |
As depicted in Table 9, the assessment of digital innovation regarding data analytics usage is rated as Highly Evident, with an overall weighted mean of 4.59. All items rated as Highly Evident, namely: data analytics help the restaurant optimize menu offerings and pricing strategies with a composite weighted mean of 4.64 as rank 1; the restaurant uses customer data to understand dining preferences and behavior; the restaurant uses data analytics to measure customer satisfaction and loyalty; and management uses data-driven insights to enhance business decision-making with a similar composite weighted mean of 4.60 as rank 2, 3, and 4; sales data are regularly analyzed to improve operational performance with a composite weighted mean of 4.59 as rank
5; marketing decisions are supported by insights drawn from customer data, with a composite weighted mean of 4.56 as rank 6; and the restaurant uses analytics to forecast demand and manage inventory effectively, with a composite weighted mean of 4.53 as rank 7.
As to assessments of the groups of respondents on digital innovation, data analytics usage was rated as Highly Evident, with restaurant managers at an overall weighted mean of 4.70, staff at 4.54, and customers at 4.52.
The top ranking for optimizing menu offerings and pricing strategies shows that data analytics is most valuable when it directly impacts product development and profit margins. Restaurants are utilizing data to see what sells best and adjust their menus accordingly. Meanwhile, the lowest ranking for forecasting demand and managing inventory suggests an operational blind spot: while data is successfully used for customer-facing and strategic decisions, integrating it into back-of-house daily stock management remains a challenge.
The strategic role of information systems in tracking trends is emphasized by Laudon & Laudon (2023), who discuss how business analytics allow firms to fine-tune consumer touchpoints and maximize operational intelligence. Locally, this pattern is corroborated by Santiago, C. A. (2022), whose research on chain restaurants in Metro Manila finds that data analytics tools significantly improve management decision-making on pricing and product positioning, even as back-of-house inventory integration is still maturing.
-
Contactless Payment Solutions
As shown in Table 10, the assessment of digital innovation regarding contactless payment solutions is rated as Highly Evident, with an overall weighted mean of 4.68. All items rated as Highly Evident, these are: the contactless payment process is fast and efficient with a composite weighted mean of 4.77 as rank 1; the restaurant offers multiple contactless payment options (e.g., GCash, PayMaya, cards) with a composite weighted mean of 4.76 as rank 2; payment terminals and QR codes are easily accessible to customers with a composite weighted mean of 4.72 as rank 3; the restaurant
| Indicators | Restaurant Managers | Staff | Customers | Composite | Rank | ||||
| WM | VI | WM | VI | WM | VI | WM | VI | ||
| The restaurant offers multiple contactless payment options (e.g., GCash, PayMaya, cards). | 5.00 | HE | 4.54 | HE | 4.74 | HE | 4.76 | HE | 2 |
| The contactless payment process is fast and efficient. | 4.92 | HE | 4.70 | HE | 4.69 | HE | 4.77 | HE | 1 |
| Customers feel secure using digital payment methods in the restaurant. | 4.58 | HE | 4.55 | HE | 4.57 | HE | 4.57 | HE | 7 |
| Contactless payments help reduce transaction errors. | 4.75 | HE | 4.58 | HE | 4.50 | HE | 4.61 | HE | 6 |
| The restaurant staff are knowledgeable in assisting with contactless transactions. | 4.92 | HE | 4.55 | HE | 4.52 | HE | 4.66 | HE | 4 |
| Payment terminals and QR codes are easily accessible to customers. | 4.83 | HE | 4.57 | HE | 4.77 | HE | 4.72 | HE | 3 |
| Contactless payment improves the overall convenience of dining or ordering. | 4.58 | HE | 4.59 | HE | 4.74 | HE | 4.64 | HE | 5 |
| Overall Weighted Mean | 4.80 | HE | 4.58 | HE | 4.65 | HE | 4.68 | HE |
staff are knowledgeable in assisting with contactless transactions with a composite weighted mean of 4.66 as rank 4; contactless payment improves the overall convenience of dining or ordering with a composite weighted mean of 4.64 as rank 5; contactless payments help reduce transaction errors with a composite weighted mean of 4.61 as rank 6; and customers feel secure using digital payment methods in the restaurant with a composite weighted mean of 4.57 as rank 7.
As to assessments of the groups of respondents on digital innovation, particularly contactless payment solutions, rated as Highly Evident, namely: restaurant managers with an overall weighted mean of 4.80, customers with an overall weighted mean of 4.65, and staff with an overall weighted mean of 4.58.
The primary emphasis on speed, efficiency, and the availability of multiple mobile wallet options (such as GCash and PayMaya) shows that consumers and operators highly value convenience and transactional versatility at the point of sale. Contactless payment is treated as an essential utility to speed up checkout queues. Conversely, the lowest ranking among customers feeling secure using digital payment methods reveals an underlying tension: while users embrace the speed and immediate accessibility of digital wallets, anxiety about cybersecurity, data privacy, and transaction vulnerabilities remains a persistent concern.
The structural transformation of modern checkout transactions is well captured by Patel (2022), who views contactless frameworks as essential catalysts for service modernization that optimize retail operational speed. Locally, this exact trend is reflected in Cruz (2021), whose study on fast-casual dining in Metro Manila notes that while digital payments significantly improve table turnover and transactional efficiency, addressing consumer hesitations about digital financial security and terminal reliability remains vital for sustained adoption.
1.5 Loyalty Program Automation
| Indicators | Restaurant Managers | Staff | Customers | Composite | Rank | ||||
| WM | VI | WM | VI | WM | VI | WM | VI | ||
| The restaurant’s loyalty program is fully integrated into its digital platforms. | 4.92 | HE | 4.49 | HE | 4.53 | HE | 4.65 | HE | 4.5 |
| Customers can easily track points and rewards through the app or website. | 4.83 | HE | 4.57 | HE | 4.61 | HE | 4.67 | HE | 2.5 |
| The loyalty program offers personalized rewards based on purchase history. | 4.92 | HE | 4.58 | HE | 4.57 | HE | 4.69 | HE | 1 |
| Automated notifications remind customers about their reward status or expiry. | 4.75 | HE | 4.59 | HE | 4.60 | HE | 4.65 | HE | 4.5 |
| The digital loyalty system encourages repeat purchases. | 4.92 | HE | 4.49 | HE | 4.52 | HE | 4.64 | HE | 6 |
| Registration and participation in the loyalty program are quick and simple. | 4.92 | HE | 4.50 | HE | 4.58 | HE | 4.67 | HE | 2.5 |
| The loyalty program effectively enhances customer engagement and retention. | 4.75 | HE | 4.55 | HE | 4.41 | HE | 4.57 | HE | 7 |
| Overall Weighted Mean | 4.86 | HE | 4.54 | HE | 4.55 | HE | 4.65 | HE |
As shown in Table 11, the assessment of digital innovation regarding loyalty program automation is rated as Highly Evident, with an overall weighted mean of 4.65. All items rated as Highly Evident, such as: the loyalty program offers personalized rewards based on purchase history with a composite weighted mean of 4.69 as rank 1; customers can easily track points and rewards through the app or website; and registration and participation in the loyalty program are quick and simple with a composite weighted mean of 4.67 as rank 2 and 3; the restaurant’s loyalty program is fully integrated into its digital platforms; and automated notifications remind customers about their reward status or expiry with both the composite weighted mean of 4.65 as rank 4 and 5; the digital loyalty system encourages repeat purchases with a composite weighted mean of 4.64 as rank 6; and the loyalty program effectively enhances customer engagement and retention with a composite weighted mean of 4.57 as rank 7.
As to assessments of the groups of respondents on digital innovation, loyalty program automation was rated as Highly Evident; the respondents were restaurant managers (overall weighted mean of 4.86), customers (4.55), and staff (4.54).
The high placement of personalized rewards based on purchase history implies that modern loyalty initiatives derive their greatest value from targeted, data-driven incentives rather than generic promotions. Customers respond positively when automated platforms acknowledge their specific buying habits and offer relevant rewards without manual friction. Conversely, the lowest ranking for the loyalty program’s overall effectiveness in enhancing customer retention reveals a critical disconnect; while users value tracking points and earning customized rewards on an individual basis, the automated system alone may not be enough to sustain long-term brand devotion if it isn't backed up by consistent service quality or deeper emotional engagement.
The strategic value of tailored consumer incentives is deeply rooted in the concepts discussed by Al-Emran, & Granić (2022), who argue that automated loyalty architectures within digital service environments are vital for maximizing customer retention when they leverage personalized user analytics. Locally, this balance is corroborated by Tan, F. (2022), whose study on the fast-casual industry in Metro Manila highlights that while automated point tracking and simple digital enrollment processes create clear transactional advantages, transforming these digital touchpoints into true brand commitment requires a holistic approach that aligns tech features with overall dining satisfaction.
| Criteria | Restaurant Managers | Staff | Customers | Composite | Rank | ||||
| WM | VI | WM | VI | WM | WM | VI | WM | ||
| Online Ordering System | 4.99 | HE | 4.60 | HE | 4.60 | HE | 4.73 | HE | 1 |
| Mobile App Features | 4.90 | HE | 4.52 | HE | 4.53 | HE | 4.65 | HE | 3.5 |
| Integration with Third-Party Delivery Platforms | 4.66 | HE | 4.56 | HE | 4.61 | HE | 4.61 | HE | 5 |
| Data Analytics Usage | 4.70 | HE | 4.54 | HE | 4.52 | HE | 4.59 | HE | 6 |
| Contactless Payment Solutions | 4.80 | HE | 4.58 | HE | 4.65 | HE | 4.68 | HE | 2 |
| Loyalty Program Automation | 4.86 | HE | 4.54 | HE | 4.55 | HE | 4.65 | HE | 3.5 |
| Grand Mean | 4.82 | HE | 4.56 | HE | 4.58 | HE | 4.65 | HE |
Table 12 summarizes the assessment of digital innovation, which is rated as Highly Evident with a grand mean of 4.65. All items rated as Highly Evident, namely: online ordering system with a composite weighted mean of 4.73 as rank 1; contactless payment solutions with a composite weighted mean of 4.68 as rank 2; mobile app features; and loyalty program automation with both the composite weighted mean of 4.65 as rank 3 and 4; integration with third-party delivery platforms with a composite weighted mean of 4.61 as rank 5; and data analytics usage with a composite weighted mean of 4.59 as rank 6.
Generally, the assessments of the groups of respondents on digital innovation are rated as Highly Evident, with restaurant managers at 4.82, customers at 4.58, and staff at 4.56.
The primary emphasis on the online ordering system and contactless payment solutions implies that digital innovation in the fast-casual sector is most successful when it targets immediate transactional convenience and queue reduction. Stakeholders prioritize technologies that streamline the core purchasing journey over back-of-house analytics or secondary partnerships. Furthermore, the highest grand mean among restaurant managers indicates that leadership perceives these digital implementations as clear operational successes, whereas the slightly lower means among staff and customers suggest that frontline users still experience minor day-to-day friction during actual system use.
The strategic prioritization of consumer-facing digital touchpoints to elevate service delivery is well noted by Smith (2021), who explains that fast-casual establishments globally achieve rapid market success by standardizing online transactions and automated payment gateways. Within the Philippine business environment, this trend is directly reinforced by Cruz (2023), whose study on digital innovations confirms that, while comprehensive tech adoption is recognized as a necessity across Metro Manila restaurants, transactional front-end tools consistently yield the highest perceived value and execution scores among industry operators.
Sub-problem No. 2. Is there a significant difference in the assessment of the three groups of respondents as to the abovementioned variables?
Table 13 presents a comparative assessment of digital innovation among restaurant managers, staff, and customers at the 0.05 level of significance, with df = 2, 18, and a critical value of 3.55. The results reveal that Online Ordering System (F = 10.7234), Mobile App Features (F = 9.77765), and Loyalty Program Automation (F = 7.57462) all exceeded the critical value, indicating significant differences among the three groups and leading to the rejection of the null hypothesis,
| Areas of Concern | SS | MSS | df | F-value | Critical Value | Interpretation | Decision | |
| Online Ordering System | Bet. Grp. Within Grp | 0.100 0.064 | 0.050 0.005 | 2 18 | 10.7234 | 3.55 | Significant | Reject Ho |
| Mobile App Features | Bet. Grp. Within Grp. | 0.095 0.087 | 0.047 0.005 | 2 18 | 9.77765 | 3.55 | Significant | Reject Ho |
| Integration with Third-Party Delivery Platforms | Bet. Grp. Within Grp. | 0.004 0.262 | 0.002 0.015 | 2 18 | 0.15299 | 3.55 | Significant | Reject Ho |
| Data Analytics Usage | Bet. Grp. Within Grp. | 0.019 0.086 | 0.010 0.005 | 2 18 | 2.03779 | 3.55 | Not Significant | Failed to Reject Ho |
| Contactless Payment Solutions | Bet. Grp. Within Grp. | 0.024 0.265 | 0.012 0.015 | 2 18 | 0.82186 | 3.55 | Not Significant | Failed to Reject Ho |
| Loyalty Program Automation | Bet. Grp. Within Grp. | 0.067 0.079 | 0.033 0.004 | 2 18 | 7.57462 | 3.55 | Significant | Reject Ho |
Level of Significance: 0.05
which implies varying perceptions likely due to differences in usage experience and operational roles.
In contrast, Integration with Third-Party Delivery Platforms (F = 0.15299), Data Analytics Usage (F = 2.03779), and Contactless Payment Solutions (F = 0.82186) all yielded F-values lower than the critical value, indicating no significant differences and a failure to reject the null hypothesis, suggesting that the respondents share relatively similar views on these aspects of digital innovation.
The significant differences in how managers, staff, and customers assess online ordering, mobile app features, and loyalty automation suggest that a respondent's role shapes their expectations and experiences with digital innovations. Managers view these systems through the lens of business oversight and ROI; staff focus on ease of handling orders under pressure; and customers care only about personal convenience. When these tools do not perfectly align with the daily needs of all three groups, it creates contrasting viewpoints. Conversely, the lack of significant differences in data analytics and contactless payments suggests a shared, uniform baseline—all three groups view payment tools as a standard utility and recognize analytics as a behind-the-scenes management function that does not alter front-of-house roles.
The structural variances in how different organizational stakeholders perceive information system implementations are highlighted by Alzoubi & Yanamandra (2022), who state that achieving strategic alignment and stakeholder acceptance across service industries requires addressing the distinct functional demands of management, front-line employees, and final consumers. Within the Philippine hospitality sector, this divergence in localized user experiences is reinforced by Reyes & Santos (2023), whose study confirms that digital platform rollouts in domestic settings frequently yield varied satisfaction levels between operating staff dealing with terminal interfaces and customers seeking quick service, proving that role-based interaction dictates how technological value is perceived.
| Indicator | Restaurant Managers | Staff | df | critical value | t-value | Decision | Interpretation | ||
| WM | SD | WM | SD | ||||||
| 1. Online Ordering System | 4.99 | 0.001 | 4.60 | 0.002 | 12 | 1.782 | 037504 | Failed to Reject Ho | Not Significant |
| Mobile App Features | 4.90 | 0.011 | 4.52 | 0.001 | 12 | 1.782 | 0.37411 | Failed to Reject Ho | Not Significant |
| Loyalty Program Automation | 4.86 | 0.005 | 4.54 | 0.002 | 12 | 1.782 | 0.31317 | Failed to Reject Ho | Not Significant |
Legend: 0.05 level of significance
Table 14 presents the post hoc comparative assessment between restaurant managers and staff on digital innovation at the 0.05 level of significance, with df = 12 and a critical t-value of 1.782. The results show that all computed t-values for Online Ordering System (t = 0.37504), Mobile App Features (t = 0.37411), and Loyalty Program Automation (t = 0.31317) are below the critical value, resulting in failure to reject the null hypothesis.
The post hoc comparison showing no significant differences between the assessments of restaurant managers and operating staff suggests a high level of operational alignment and shared reality within the establishment's internal hierarchy. Because both groups interact directly with the backend interfaces of the online ordering systems, mobile applications, and automated loyalty frameworks, they encounter the same technical efficiencies and workflow bottlenecks during daily shifts. This statistical consensus indicates that the digital infrastructure is consistently deployed, meaning management's strategic vision for technology implementation aligns with frontline personnel’s real-world execution.
This internal structural harmony closely aligns with the conceptual frameworks presented by Carranza (2024), who emphasizes that achieving true competitive advantage in fast-casual dining relies heavily on successful digital-human alignment, in which business infrastructure satisfies both executive strategies and employees' operational realities. Locally, this cohesive baseline is mirrored by the perspectives outlined in the Philippine Development Plan (PDP) 2023–2028 (National Economic and Development Authority, 2023), which notes that systematic, workplace-wide digitalization efforts succeed when they build uniform technical readiness and shared operational understanding among managers and staff members alike.
| Indicator | Restaurant Managers | Customers | df | critical value | t-value | Decision | Interpretation | ||
| WM | SD | WM | SD | ||||||
| 1. Online Ordering System | 4.99 | 0.001 | 4.60 | 0.012 | 12 | 1.782 | 0.37646 | Failed to Reject Ho | Not Significant |
| Mobile App Features | 4.90 | 0.011 | 4.53 | 0.003 | 12 | 1.782 | 0.36130 | Failed to Reject Ho | Not Significant |
| Loyalty Program Automation | 4.86 | 0.005 | 4.55 | 0.002 | 12 | 1.782 | 0.30606 | Failed to Reject Ho | Not Significant |
Legend: 0.05 level of significance
Table 15 presents the post hoc comparison between restaurant managers and customers on digital innovation at the 0.05 level of significance, with df = 12 and a critical t-value of 1.782. The findings reveal that all computed t-values for Online Ordering System (t = 0.37646), Mobile App Features (t = 0.36130), and Loyalty Program Automation (t = 0.30606) are below the critical value, resulting in failure to reject the null hypothesis.
The result implies that restaurant managers and customers share a similar perception of digital innovation tools, indicating consistent acceptance and understanding of online ordering systems, mobile app features, and loyalty program automation.
| Indicator | Staff | Customers | df | critical value | t-value | Decision | Interpretation | ||
| WM | SD | WM | SD | ||||||
| 1. Online Ordering System | 4.60 | 0.002 | 4.60 | 0.012 | 12 | 1.782 | 0.00141 | Failed to Reject Ho | Not Significant |
| Mobile App Features | 4.52 | 0.001 | 4.53 | 0.003 | 12 | 1.782 | 0.01282 | Failed to Reject Ho | Not Significant |
| Loyalty Program Automation | 4.54 | 0.002 | 4.55 | 0.002 | 12 | 1.782 | 0.00711 | Failed to Reject Ho | Not Significant |
Legend: 0.05 level of significance
Table 16 shows the post hoc comparative assessment between staff and customers on digital innovation at the 0.05 level of significance, with df = 12 and a critical t-value of 1.782. The results reveal that all computed t-values for Online Ordering System (t = 0.00141), Mobile App Features (t = 0.01282), and Loyalty Program Automation (t = 0.00711) are far below the critical value, leading to the failure to reject the null hypothesis.
The post hoc test showing no statistically significant differences between restaurant managers and customers suggests strong alignment between what the business provides and what the consumer experiences. Because both groups evaluate the online ordering system, mobile app features, and loyalty program automation with similarly high praise, it indicates that the technology successfully delivers on its external promises. This perceptual consensus shows that management’s operational standards for digital convenience match the real-world utility and user-friendliness expected by the dining public, creating a balanced and effective digital customer journey.
This perceptual alignment between service providers and consumers is strongly supported by Lemon & Verhoef (2021), who emphasize that a successful digital customer journey occurs when business touchpoints are systematically designed to match consumer expectations for ease and accessibility. Locally, this uniform acceptance is reinforced by Delos Santos (2020), whose work on online systems in Metro Manila fast-casual chains highlights that when digital dining interfaces are robust and customer-centric, they naturally bridge the gap between operational management goals and user convenience, resulting in a shared positive evaluation from both groups.
Sub-problem No. 3. How do the respondents assess the Service Quality of Selected Fast Casual Restaurants as to:
3.1 Responsiveness to Customer Requests
| Indicators | Restaurant Managers | Staff | Customers | Composite | Rank | ||||
| WM | VI | WM | VI | WM | VI | WM | VI | ||
| Staff promptly attend to customer needs and inquiries. | 4.92 | E | 4.69 | E | 4.79 | E | 4.80 | E | 1 |
| Orders and special requests are handled without unnecessary delay. | 4.58 | E | 4.55 | E | 4.69 | E | 4.61 | E | 4 |
| Employees demonstrate willingness to always help customers. | 4.83 | E | 4.57 | E | 4.48 | E | 4.63 | E | 3 |
| The restaurant provides timely responses to online or phone inquiries. | 4.58 | E | 4.51 | E | 4.54 | E | 4.54 | E | 6 |
| Service personnel remain attentive even during peak hours. | 4.50 | E | 4.50 | E | 4.39 | E | 4.46 | E | 7 |
| The restaurant offers quick solutions when customers have issues or concerns. | 4.92 | E | 4.55 | E | 4.58 | E | 4.68 | E | 2 |
| The staff are proactive in offering assistance or additional services. | 4.75 | E | 4.57 | E | 4.43 | E | 4.58 | E | 5 |
| Overall Weighted Mean | 4.73 | E | 4.56 | E | 4.56 | E | 4.62 | E |
Legend:
Range Scale Verbal Interpretation Symbol
54.20-5.00Excellent E
43.40-4.19Very Satisfactory VS
32.60-3.39Satisfactory S
21.80-2.59Fair F
11.00-1.79Poor P
As shown in Table 17, the assessment of service quality in terms of responsiveness to customer requests is rated Excellent, with an overall weighted mean of 4.62. All items rated as Excellent, these are: staff promptly attend to customer needs and inquiries with a composite weighted mean of 4.80 as rank 1; the restaurant offers quick solutions when customers have issues or concerns with a composite weighted mean of 4.68 as rank 2; employees demonstrate willingness to always help customers with a composite weighted mean of 4.63 as rank 3; orders and special requests are handled without unnecessary delay with a composite weighted mean of 4.61 as rank 4; the staff are proactive in offering assistance or additional services with a composite weighted mean of 4.58 as rank 5; the restaurant provides timely responses to online or phone inquiries with a composite weighted mean of 4.54 as rank 6; and service personnel remain attentive even during peak hours with a composite weighted mean of 4.46 as rank 7.
As to assessments of the groups of respondents on service quality, responsiveness to customer requests was rated Excellent, namely: restaurant managers with an overall weighted mean of 4.73, and staff and customers, with both at an overall weighted mean of 4.56.
The primary emphasis on staff promptly attending to customer needs and inquiries implies that human responsiveness remains the most vital cornerstone of high-quality food service, even in an increasingly digitized dining landscape. Customers place the highest value on immediate, attentive interactions when resolving questions, suggesting that a restaurant's operational speed should not rely solely on software, but must be matched by frontline agility. Conversely, the lowest ranking for service personnel remaining attentive during peak hours points to a critical resource-stress test; it indicates that when foot traffic spikes, real-world operational pressure makes it highly challenging for human staff to maintain the same meticulous level of dedication and individual care.
The fundamental necessity of maintaining a highly responsive frontline team during service encounters is well aligned with the operational frameworks highlighted by Vial (2023), who argues that digital business structures achieve maximum utility only when they successfully enhance—rather than replace—the human touchpoints within the customer journey. Locally, this exact challenge is underscored by Rivera (2021), whose research on restaurant systems in the Philippines shows that while automated solutions handle standard transactions smoothly, the ultimate standard of customer service excellence is dictated by how dynamically and proactively physical personnel manage customer inquiries under high-volume pressure.
3.2 Reliability of Service Delivery
| Indicators | Restaurant Managers | Staff | Customers | Composite | Rank | ||||
| WM | VI | WM | VI | WM | VI | WM | VI | ||
| The restaurant consistently delivers orders accurately. | 4.75 | E | 4.61 | E | 4.73 | E | 4.70 | E | 1 |
| Customers receive their meals within the promised time frame. | 4.58 | E | 4.50 | E | 4.54 | E | 4.54 | E | 7 |
| The restaurant maintains consistency in food quality and taste. | 5.00 | E | 4.51 | E | 4.43 | E | 4.65 | E | 3.5 |
| Service performance is dependable regardless of customer volume. | 4.58 | E | 4.43 | E | 4.70 | E | 4.57 | E | 5 |
| Online and dine-in orders are processed with minimal errors. | 4.83 | E | 4.45 | E | 4.68 | E | 4.65 | E | 3.5 |
| Customers can rely on the restaurant to deliver what it promises. | 4.67 | E | 4.53 | E | 4.44 | E | 4.55 | E | 6 |
| The restaurant provides consistent operating hours and availability. | 4.92 | E | 4.58 | E | 4.52 | E | 4.67 | E | 2 |
| Overall Weighted Mean | 4.76 | E | 4.52 | E | 4.58 | E | 4.62 | E |
As established in Table 18, the assessment of service quality with respect to the reliability of service delivery is rated Excellent, with an overall weighted mean of 4.62. All items rated as Excellent, such as: the restaurant consistently delivers orders accurately with a composite weighted mean of 4.70 as rank 1; the restaurant provides consistent operating hours and availability with a composite weighted mean of 4.67 as rank 2; the restaurant maintains consistency in food quality and taste; and online and dine-in orders are processed with minimal errors with both the composite weighted mean of 4.65 as rank 3 and 4; service performance is dependable regardless of customer volume with a composite weighted mean of 4.57 as rank 5; customers can rely on the restaurant to deliver what it promises with a composite weighted mean of 4.55 as rank 6; and customers receive their meals within the promised time frame with a composite weighted mean of 4.54 as rank 7.
As to assessments of the groups of respondents on service quality, the reliability of service delivery was rated Excellent; these are: restaurant managers with an overall weighted mean of 4.76, customers with an overall weighted mean of 4.58, and staff with an overall weighted mean of 4.52.
The top positioning of the restaurant for consistently delivering orders accurately implies that precision in execution is the most crucial element in building trust in service quality. While consumers and employees value speed, an accurate order serves as the baseline for a reliable dining experience. On the other hand, the lowest ranking among customers receiving their meals within the promised timeframe reveals an operational vulnerability: even when order accuracy is mastered, maintaining predictable delivery and preparation speeds remains a logistical hurdle during busy restaurant periods.
The fundamental connection between operational accuracy and consumer trust is emphasized by Evans (2023), who explains that service reliability in digital-first dining environments forms the bedrock of customer retention and long-term trust. In the context of the domestic market, this reality is corroborated by Bautista (2022), whose research on casual dining environments highlights that while tech-driven updates improve ordering workflows, an establishment's physical capability to eliminate errors and maintain time predictability ultimately defines exceptional service reliability.
3.3. Tangibles
| Indicators | Restaurant Managers | Staff | Customers | Composite | Rank | ||||
| WM | VI | WM | VI | WM | VI | WM | VI | ||
| The restaurant maintains a clean and orderly dining area. | 4.83 | E | 4.68 | E | 4.62 | E | 4.71 | E | 1 |
| Tables, chairs, and utensils are well-maintained and hygienic. | 4.75 | E | 4.70 | E | 4.53 | E | 4.66 | E | 4 |
| The staff’s uniforms are neat and presentable. | 4.83 | E | 4.55 | E | 4.56 | E | 4.65 | E | 5 |
| The restaurant’s digital facilities (e.g., self-order kiosks, screens) are functional and modern. | 5.00 | E | 4.54 | E | 4.47 | E | 4.67 | E | 2.5 |
| The overall ambiance of the restaurant is pleasant and comfortable. | 4.67 | E | 4.66 | E | 4.56 | E | 4.63 | E | 6 |
| The restaurant’s layout allows for easy movement of customers and staff. | 4.75 | E | 4.54 | E | 4.56 | E | 4.62 | E | 7 |
| Printed and digital materials (e.g., menus, displays) are visually appealing and updated. | 4.92 | E | 4.55 | E | 4.53 | E | 4.67 | E | 2.5 |
| Overall Weighted Mean | 4.82 | E | 4.60 | E | 4.55 | E | 4.66 | E |
As shown in Table 19, the assessment of service quality regarding tangibles is rated Excellent, with an overall weighted mean of 4.66. All items rated as Excellent, namely: the restaurant maintains a clean and orderly dining area with a composite weighted mean of 4.71 as rank 1; the restaurant’s digital facilities (e.g., self-order kiosks, screens) are functional and modern; and printed and digital materials (e.g., menus, displays) are visually appealing and updated with both the composite weighted mean of 4.67 as rank 2 and 3; tables, chairs, and utensils are well-maintained and hygienic with a composite weighted mean of 4.66 as rank 4; the staff’s uniforms are neat and presentable with a composite weighted mean of 4.65 as rank 5; the overall ambiance of the restaurant is pleasant and comfortable with a composite weighted mean of 4.63 as rank 6; and the restaurant’s layout allows for easy movement of customers and staff with a composite weighted mean of 4.62 as rank 7.
As to assessments of the groups of respondents on service quality, tangibles were rated as Excellent, with restaurant managers at an overall weighted mean of 4.82, staff at 4.60, and customers at 4.55.
The strong emphasis on maintaining a clean and orderly dining area suggests that physical hygiene and foundational cleanliness remain the top priority for consumers and workers, even as digital features expand. Traditional hospitality basics remain the core drivers of a customer's sensory impression. On the other hand, the lowest ranking for the restaurant's layout, allowing easy movement of customers and staff, highlights a common architectural and operational pain point; it indicates that while digital ordering and functional modern kiosks successfully speed up transactions, physical spaces can become congested bottlenecks if spatial flow and floor layout are not optimized to handle the resulting customer traffic.
The strategic role of physical design elements in shaping consumer evaluation is highlighted by Schneider (2022), who notes that the perceived quality of service environments relies heavily on a firm's ability to maintain excellent physical conditions alongside functional digital assets. On a local scale, this finding relates closely to the work of Lopez (2024), whose study on fast-casual dining spaces in Metro Manila details that while modern digital displays and self-order kiosks add strong modern value, a clean environment and well-planned spatial floor layout are essential to prevent staff friction and maintain high overall customer satisfaction.
3.4 Assurance
| Indicators | Restaurant Managers | Staff | Customers | Composite | Rank | ||||
| WM | VI | WM | VI | WM | VI | WM | VI | ||
| Staff demonstrate confidence and competence in performing their duties. | 4.92 | E | 4.57 | E | 4.70 | E | 4.73 | E | 2 |
| Employees provide clear and accurate information about menu items. | 4.92 | E | 4.53 | E | 4.34 | E | 4.60 | E | 7 |
| Customers feel safe when making transactions within the restaurant. | 5.00 | E | 4.62 | E | 4.69 | E | 4.77 | E | 1 |
| Staff handle payments and digital transactions professionally. | 4.83 | E | 4.58 | E | 4.70 | E | 4.70 | E | 3 |
| The restaurant enforces proper hygiene and food safety standards. | 4.92 | E | 4.51 | E | 4.39 | E | 4.61 | E | 6 |
| Employees always display courteous and respectful behavior. | 4.75 | E | 4.57 | E | 4.60 | E | 4.64 | E | 5 |
| Customers trust the restaurant’s brand and service quality. | 5.00 | E | 4.59 | E | 4.44 | E | 4.68 | E | 4 |
| Overall Weighted Mean | 4.91 | E | 4.57 | E | 4.55 | E | 4.67 | E |
As shown in Table 20, the assessment of service quality regarding assurance is rated Excellent, with an overall weighted mean of 4.67. All items rated as Excellent, these are: customers feel safe when making transactions within the restaurant with a composite weighted mean of 4.77 as rank 1; staff demonstrate confidence and competence in performing their duties with a composite weighted mean of 4.73 as rank 2; staff handle payments and digital transactions professionally with a composite weighted mean of 4.70 as rank 3; customers trust the restaurant’s brand and service quality with a composite weighted mean of 4.68 as rank 4; employees always display courteous and respectful behavior with a composite weighted mean of 4.64 as rank 5; the restaurant enforces proper hygiene and food safety standards with a composite weighted mean of 4.61 as rank 6; and employees provide clear and accurate information about menu items with a composite weighted mean of 4.60 as rank 7.
As to assessments of the groups of respondents on the service quality, assurance was rated as Excellent, namely: restaurant managers with an overall weighted mean of 4.91, staff with an overall weighted mean of 4.57, and customers with an overall weighted mean of 4.55.
The fact that customers feel safe when making transactions within the restaurant scored highest implies that trust and financial security serve as the ultimate foundation for consumer assurance in food establishments. While digital tools, hygiene, and product knowledge are highly valued, an environment in which patrons feel their information and assets are safe is critical to overall peace of mind. Conversely, the lowest ranking among employees providing clear and accurate information about menu items highlights a communication bottleneck: while staff behave courteously and handle payments professionally, keeping them fully up to date on fast-moving menu developments, allergen specifics, or recipe details remains a persistent training challenge.
The vital relationship between transactional security and consumer confidence is well recognized by Kwon (2023), who observes that establishing a secure operational environment is the single most important factor in building customer confidence and corporate trust in modern service environments. Within the Philippine context, this dynamic is supported by Santos (2022), whose analysis of service quality in Metro Manila restaurants shows that while digital systems and physical protocols boost business credibility, systematic workforce training programs are essential to ensure employees can accurately convey changing menu details to dining guests.
3.5 Empathy
As identified in Table 21, the assessment of service quality regarding empathy is rated Excellent, with an overall weighted mean of 4.64. All items rated as Excellent, such as: the restaurant provides special accommodation for customers with specific needs (e.g., elderly, PWDs) with a composite weighted mean of 4.75 as rank 1; staff show genuine care and attention toward customers’ needs; and the restaurant promotes a welcoming and inclusive atmosphere with both the composite weighted mean of 4.70 as rank 2 and 3; management ensures that customers feel valued and appreciated with a composite weighted mean of 4.62 as rank 4; employees take time to listen to customer feedback and suggestions; and the
| Indicators | Restaurant Managers | Staff | Customers | Composite | Rank | ||||
| WM | VI | WM | VI | WM | VI | WM | VI | ||
| Staff show genuine care and attention toward customers’ needs. | 4.83 | E | 4.59 | E | 4.67 | E | 4.70 | E | 2.5 |
| The restaurant provides special accommodation for customers with specific needs (e.g., elderly, PWDs). | 5.00 | E | 4.64 | E | 4.60 | E | 4.75 | E | 1 |
| Employees take time to listen to customer feedback and suggestions. | 4.75 | E | 4.45 | E | 4.56 | E | 4.59 | E | 5.5 |
| The restaurant values regular customers and remembers their preferences. | 4.75 | E | 4.49 | E | 4.52 | E | 4.59 | E | 5.5 |
| Service personnel display patience when dealing with customer concerns. | 4.67 | E | 4.50 | E | 4.48 | E | 4.55 | E | 7 |
| Management ensures that customers feel valued and appreciated. | 4.83 | E | 4.51 | E | 4.53 | E | 4.62 | E | 4 |
| The restaurant promotes a welcoming and inclusive atmosphere. | 5.00 | E | 4.59 | E | 4.50 | E | 4.70 | E | 2.5 |
| Overall Weighted Mean | 4.83 | E | 4.54 | E | 4.55 | E | 4.64 | E |
restaurant values regular customers and remembers their preferences with both the composite weighted mean of 4.59 as rank 5 and 6; and service personnel display patience when dealing with customer concerns with a composite weighted mean of 4.55 as rank 7.
As to assessments of the groups of respondents on the service quality, empathy was rated as Excellent; these are: restaurant managers with an overall weighted mean of 4.83, customers with an overall weighted mean of 4.55, and staff with an overall weighted mean of 4.54.
The highest ranking for providing special accommodations for customers with specific needs (such as the elderly and PWDs) implies that empathy in service quality is most strongly felt when a restaurant builds inclusive, equitable dining experiences. Consumers and staff recognize that true care goes beyond standardized politeness; it requires active hospitality that supports vulnerable groups. Conversely, the lowest ranking for service personnel displaying patience when dealing with customer concerns reveals a predictable human limitation. When restaurants face high stress or fast-paced volumes, staff members find it increasingly difficult to slow down, regulate their emotions, and maintain a deeply patient demeanor during challenging customer complaints.
The operational value of proactive, inclusive hospitality within service frameworks is emphasized by Gibson (2023), who states that empathy-driven service architectures drastically elevate customer satisfaction when physical facilities and employee interactions adapt to diverse consumer groups. Locally, this standard of personalized care aligns with Navarro (2022), whose analysis of service culture in Philippine quick-casual businesses notes that while structural accommodations for seniors and PWDs are well-regarded and statutory across Metro Manila, the emotional labor required to maintain consistency in staff patience under intense operational pressure demands ongoing soft-skills reinforcement.
3.6 Handling of Complaints
| Indicators | Restaurant Managers | Staff | Customers | Composite | Rank | ||||
| WM | VI | WM | VI | WM | VI | WM | VI | ||
| Customer complaints are addressed quickly and professionally. | 5.00 | E | 4.57 | E | 4.63 | E | 4.73 | E | 2 |
| Staff listen carefully to customer grievances before providing a solution. | 4.92 | E | 4.69 | E | 4.72 | E | 4.78 | E | 1 |
| The restaurant has a clear and accessible complaint resolution process. | 4.67 | E | 4.53 | E | 4.64 | E | 4.61 | E | 5.5 |
| Corrective actions are taken immediately when service lapses occur. | 4.83 | E | 4.57 | E | 4.42 | E | 4.61 | E | 5.5 |
| Customers receive feedback or follow-up after filing a complaint. | 4.75 | E | 4.51 | E | 4.50 | E | 4.59 | E | 7 |
| Management uses customer complaints to improve future service delivery. | 4.92 | E | 4.50 | E | 4.51 | E | 4.64 | E | 4 |
| The restaurant maintains a positive attitude when resolving conflicts. | 5.00 | E | 4.53 | E | 4.42 | E | 4.65 | E | 3 |
| Overall Weighted Mean | 4.87 | E | 4.56 | E | 4.55 | E | 4.66 | E |
As illustrated in Table 22, the assessment of service quality regarding empathy, rated as handling of complaints, is rated Excellent, with an overall weighted mean of 4.66. All items rated as Excellent, namely: staff listen carefully to customer grievances before providing a solution with a composite weighted mean of 4.78 as rank 1; customer complaints are addressed quickly and professionally with a composite weighted mean of 4.73 as rank 2; the restaurant maintains a positive attitude when resolving conflicts with a composite weighted mean of 4.65 as rank 3; management uses customer complaints to improve future service delivery with a composite weighted mean of 4.64 as rank 4; the restaurant has a clear and accessible complaint resolution process; and corrective actions are taken immediately when service lapses occur with both the composite weighted mean of 4.61 as rank 5 and 6; and customers receive feedback or follow-up after filing a complaint with a composite weighted mean of 4.59 as rank 7.
As to assessments of the groups of respondents on service quality, empathy was rated as Excellent for the handling of complaints, with restaurant managers at an overall weighted mean of 4.87, staff at 4.56, and customers at 4.55.
The top ranking for staff listening carefully to customer grievances before providing a solution implies that deep validation and emotional pacing are the most valued elements in service recovery. Customers prioritize being heard and understood over a rushed fix, showing that interpersonal respect is essential when a system breakdown occurs. Conversely, the lowest ranking among customers receiving feedback or a follow-up after filing a complaint reveals a post-incident gap: while establishments excel at de-escalating issues face-to-face on the floor, their administrative structure lacks the systematic tracking needed to maintain long-term communication once the customer leaves.
The strategic value of active listening during service recovery encounters is well supported by Thomas (2023), who argues that the longevity of service relationships hinges on an organization’s emotional capacity to validate consumer grievances before implementing logistical fixes. Locally, this communication trend aligns with Fernandez's (2022) observations on operational service quality in Manila’s casual dining sector, which explain that while Filipino hospitality culture naturally fosters empathetic, face-to-face problem-solving, casual food establishments frequently struggle to sustain structured CRM follow-ups once a localized conflict has been initially settled.
| Criteria | Restaurant Managers | Staff | Customers | Composite | Rank | ||||
| WM | VI | WM | VI | WM | WM | VI | WM | ||
| Responsiveness to Customer Requests | 4.73 | E | 4.56 | E | 4.56 | E | 4.62 | E | 5.5 |
| Reliability of Service Delivery | 4.76 | E | 4.52 | E | 4.58 | E | 4.62 | E | 5.5 |
| Tangibles | 4.82 | E | 4.60 | E | 4.55 | E | 4.66 | E | 2.5 |
| Assurance | 4.91 | E | 4.57 | E | 4.55 | E | 4.67 | E | 1 |
| Empathy | 4.83 | E | 4.54 | E | 4.55 | E | 4.64 | E | 4 |
| Handling of Complaints | 4.87 | E | 4.56 | E | 4.55 | E | 4.66 | E | 2.5 |
| Grand Mean | 4.82 | E | 4.56 | E | 4.56 | E | 4.65 | E |
Table 23 summarizes the assessment of the service quality rated as Excellent, with a grand mean of 4.65. All items rated as Excellent, these are: assurance with a composite weighted mean of 4.67 as rank 1; tangibles; and handling of complaints with both the composite weighted mean of 4.66 as rank 2 and 3; empathy with a composite weighted mean of 4.64 as rank 4; and responsiveness to customer requests; and reliability of service delivery with both the composite weighted mean of 4.62 as rank 5 and 6.
Generally, the assessments of the groups of respondents on service quality were rated as Excellent, namely, restaurant managers with a grand mean of 4.82 and staff and customers with a grand mean of 4.56.
The high overall evaluation of service quality suggests that fast-casual restaurants consistently deliver well-balanced service performance across responsiveness, reliability, tangibles, assurance, empathy, and complaint handling, resulting in strong customer satisfaction and trust.
The top ranking for assurance implies that building transactional safety, technical confidence, and credibility is the most fundamental driver of overall service quality in modernized casual dining. Customers prioritize feeling secure and trusting the establishment above all other dimensions. Conversely, the tie for the lowest positions between responsiveness to customer requests and reliability of service delivery points to a common operational bottleneck: while an establishment may possess excellent modern tangibles and empathetic staff, consistently meeting promised mealtime frames and maintaining flawless frontline attention during high-volume spikes remain the most vulnerable areas of day-to-day operations.
The strategic dominance of security and credibility over secondary transactional traits is highlighted by Parasuraman, Zeithaml, & Malhotra (2020), who argue that customer perceptions of service quality are anchored primarily on foundational trust and structural safety metrics before operational speed factors come into play. Locally, this exact structural hierarchy matches the conclusions of Aguirre (2024), whose work on the fast-casual restaurant ecosystem in urban centers like Metro Manila notes that while physical aesthetics and empathetic service recovery are highly prized by the dining public, establishing unwavering transactional trust is what secures brand equity, even when peak-hour foot traffic strains operational responsiveness and delivery timeframes.
Sub-problem No. 4. Is there a significant relationship between digital innovation and service quality of selected fast casual restaurants?
| Indicators | r-value | VI | df | t-value | Critical value | Int. | Decision |
| Responsiveness to Customer Requests | 0.99 | VSC | 12 | 3.46369 | 1.782 | Significant | Reject Ho |
| Reliability of Service Delivery | 0.99 | VSC | 12 | 3.46373 | 1.782 | Significant | Reject Ho |
| Tangibles | 1.00 | PC | 12 | 3.46402 | 1.782 | Significant | Reject Ho |
| Assurance | 0.99 | VSC | 12 | 3.46381 | 1.782 | Significant | Reject Ho |
| Empathy | 0.99 | VSC | 12 | 3.46389 | 1.782 | Significant | Reject Ho |
| Handling of Complaints | 0.99 | VSC | 12 | 3.46392 | 1.782 | Significant | Reject Ho |
Legend:
RangeVerbal InterpretationSymbol
1.0Perfect Correlation PC
0.71 – 0.99Very Strong CorrelationVSC
0.51 - 0.70Strong CorrelationSC
0.31 – 0.50Moderate CorrelationMC
0.11 – 0.30Weak CorrelationWC
0.0 – 0.10Weak CorrelationWC
Table 24 presents the correlation between digital innovation and service quality for selected fast-casual restaurants, showing that all indicators exhibit very strong to perfect positive relationships. Specifically, Responsiveness to Customer Requests obtained an r-value of 0.99 (Very Strong Correlation) with a t-value of 3.46369, while Reliability of Service Delivery also recorded an r-value of 0.99 (Very Strong Correlation) and a t-value of 3.46373. In terms of Tangibles, the result showed a perfect correlation (r = 1.00) with a t-value of 3.46402. For Assurance, the r-value is 0.99 (Very Strong Correlation) with a t-value of 3.46381, while Empathy obtained an r-value of 0.99 (Very Strong Correlation) and a t-value of 3.46389. Lastly, Handling of Complaints registered an r-value of 0.99 (Very Strong Correlation) with a t-value of 3.46392. All computed t-values exceeded the critical value of 1.782 at the 0.05 level of significance (df = 12), leading to the rejection of the null hypothesis and confirming that digital innovation has a significant and positive relationship with all dimensions of service quality.
The near-perfect and perfect positive correlations between digital innovation and all service quality dimensions imply that technological advancements are completely interwoven with modern hospitality performance. Digital tools do not act merely as standalone operational upgrades; instead, they serve as the direct engine driving enhanced customer interactions, reliability, and store environments. When a restaurant's digital execution excels, its perceived service quality rises symmetrically. In particular, the perfect correlation with tangibles reveals that digital infrastructure (like self-order kiosks, digital displays, and modern terminal designs) has redefined the physical dining environment itself, making technology an inseparable component of a restaurant's modern physical presence.
This systemic link between technological maturity and multi-dimensional service excellence is strongly supported by Bharadwaj (2021), who posits that digital transformation within consumer-facing sectors operates as an architectural force that fundamentally elevates every metric of organizational service delivery. In the domestic restaurant landscape, this comprehensive interdependence is reflected in Alvarez (2023), whose study on digital-first dining in key Philippine business districts demonstrates that high-performing tech systems consistently yield higher service marks, reinforcing the reality that modern fast-casual business models can no longer decouple operational quality from their digital infrastructure.
Sub-problem No. 5. What are the problems encountered in terms of digital innovation and service quality?
As indicated in Table 25, the problems encountered regarding digital innovation and service quality are rated as Very Least Encountered, with an overall weighted mean of 1.53. All items rated as Very Least Encountered, such as: some digital payment options are not consistently available, with a composite weighted mean of 1.66 as rank 1; frequent
| Indicators | Restaurant Managers | Staff | Customers | Composite | Rank | ||||
| WM | VI | WM | VI | WM | VI | WM | VI | ||
| Frequent system glitches make ordering inconvenient. | 1.50 | VLE | 1.73 | VLE | 1.68 | VLE | 1.64 | VLE | 2 |
| The app lacks user-friendly features for easy navigation. | 1.33 | VLE | 1.85 | LE | 1.56 | VLE | 1.58 | VLE | 3 |
| Delays occur when processing orders through delivery partners. | 1.17 | VLE | 1.70 | VLE | 1.58 | VLE | 1.48 | VLE | 8.5 |
| The restaurant does not fully utilize customer data for improvement. | 1.17 | VLE | 1.74 | VLE | 1.52 | VLE | 1.48 | VLE | 8.5 |
| Some digital payment options are not consistently available. | 1.42 | VLE | 1.70 | VLE | 1.87 | LE | 1.66 | VLE | 1 |
| The rewards system often fails to update or record points correctly. | 1.08 | VLE | 1.66 | VLE | 1.67 | VLE | 1.47 | VLE | 10.5 |
| Staff are sometimes slow to respond to customer inquiries or needs. | 1.08 | VLE | 1.73 | VLE | 1.77 | VLE | 1.53 | VLE | 5 |
| Orders are occasionally inaccurate or incomplete. | 1.17 | VLE | 1.73 | VLE | 1.67 | VLE | 1.52 | VLE | 6.5 |
| Dining areas and facilities are not consistently well-maintained. | 1.08 | VLE | 1.72 | VLE | 1.76 | VLE | 1.52 | VLE | 6.5 |
| Some staff lack confidence and knowledge when addressing customer concerns. | 1.08 | VLE | 1.65 | VLE | 1.69 | VLE | 1.47 | VLE | 10.5 |
| Employees rarely show genuine concern for customer satisfaction. | 1.25 | VLE | 1.69 | VLE | 1.77 | VLE | 1.57 | VLE | 4 |
| Customer complaints are not always resolved in a timely and satisfactory manner. | 1.00 | VLE | 1.58 | VLE | 1.69 | VLE | 1.42 | VLE | 12 |
| Overall Weighted Mean | 1.19 | VLE | 1.71 | VLE | 1.69 | VLE | 1.53 | VLE |
Legend:
Range Scale Verbal Interpretation Symbol
54.20-5.00Highly Encountered HE
43.40-4.19Encountered E
32.60-3.39Moderately Encountered ME
21.80-2.59Least Encountered LE
11.00-1.79Very Least Encountered VLE
system glitches make ordering inconvenient with a composite weighted mean of 1.64 as rank 2; the app lacks user-friendly features for easy navigation with a composite weighted mean of 1.58 as rank 3; employees rarely show genuine concern for customer satisfaction with a composite weighted mean of 1.57 as rank 4; staff are sometimes slow to respond to customer inquiries or needs with a composite weighted mean of 1.53 as rank 5; orders are occasionally inaccurate or incomplete; and dining areas and facilities are not consistently well-maintained with both the composite weighted mean of 1.52 as rank 6 and 7; delays occur when processing orders through delivery partners; and the restaurant does not fully utilize customer data for improvement with both the composite weighted mean of 1.48 as rank 8 and 9; the rewards system often fails to update or record points correctly; and some staff lack confidence and knowledge when addressing customer concerns with both the composite weighted mean of 1.47 as rank 10 and 11; and customer complaints are not always resolved in a timely and satisfactory manner with a composite weighted mean of 1.42 as rank 12.
As to assessments of the groups of respondents on the problems encountered in terms of digital innovation and service quality, rated as Very Least Encountered, these are: staff (overall weighted mean: 1.71), customers (overall weighted mean: 1.69), and restaurant managers (overall weighted mean: 1.19).
The fact that inconsistent availability of digital payment options ranked highest among the problems encountered implies that transactional friction remains a primary vulnerability in digitized quick-service ecosystems. Even when overall problems are minimal, customers and frontline staff are acutely sensitive to payment terminal dropouts or unsupported mobile wallets because they immediately stall the checkout process. Conversely, the fact that the timely resolution of customer complaints scored lowest (the absolute least encountered problem) implies an exceptional baseline for immediate, on-the-floor troubleshooting. It indicates that while backend digital networks or payment gateways may occasionally experience minor connectivity hiccups, the restaurant's operational personnel are highly efficient at stepping in to fix issues before they escalate into lasting grievances.
The critical importance of payment stability in tech-enabled environments is well supported by Gartner (2022), which observes that operational disruptions at the point of sale (POS) have an outsized negative impact on user experience because they directly interrupt the core transaction phase. In the domestic environment, this dynamic aligns closely with findings by Villanueva(2023), whose research on casual dining networks in the Philippines reveals that while local restaurant consumers are generally highly forgiving of minor app layout bugs, payment gateway inconsistencies cause immediate operational friction that pressures frontline staff and strains real-time service delivery.
Sub-problem No. 6. Based on the findings, what competitive advantage plan may be proposed?
The proposed Competitive Advantage Plan is anchored on transforming excellent operational performance outcomes into sustainable competitive advantages. While fast-casual restaurants demonstrate robust capabilities in digital innovation and service quality, sustaining market leadership requires systematic planning, resource allocation, and continuous monitoring. The plan addresses minor operational gaps and reinforces core strengths to dynamically adapt to shifting customer expectations, technological trends, and market competition.
The structured action matrix organized by Key Result Areas (KRAs), encompassing objectives, strategies, specific activities, departments responsible, exact timelines, budgets, and performance indicators directly drawn from the operational framework:
Proposed Competitive Advantage Plan
Introduction
The proposed Competitive Advantage Plan is based on findings that both the Digital Innovation and Service Quality dimensions in selected fast-casual restaurants are consistently rated as highly evident and excellent by restaurant managers, staff, and customers. These results indicate that the establishments already possess strong operational capabilities and customer-oriented practices that contribute to their current market performance. However, in an increasingly competitive and technology-driven food service industry, maintaining these high levels of performance requires continuous improvement, innovation, and sustainability-focused strategies.
Thus, the plan is designed not only to address minor gaps identified in lower-ranked indicators but, more importantly, to sustain and strengthen existing best practices that support long-term competitiveness.
Title: Competitive Advantage Plan
Rationale
The proposed plan is anchored on the need to transform strong performance outcomes into sustainable competitive advantages. While the findings reveal that digital systems (e.g., online ordering, mobile applications, contactless payments, and data analytics) and service quality dimensions (e.g., responsiveness, reliability, assurance, empathy, tangibles, and complaint handling) are already well-established, sustaining these requires systematic planning, resource allocation, and continuous monitoring. Moreover, the dynamic nature of customer expectations, technological advancements, and market competition necessitates proactive strategies to ensure that service excellence and innovation are consistently delivered. The plan therefore focuses on reinforcing strengths, improving weaker areas, and integrating data-driven and customer-centric approaches to sustain long-term business success.
Objectives
The proposed Competitive Advantage Plan aims to:
1. Sustain and enhance the current high levels of digital innovation and service quality across all operational areas of the restaurant.
2. Strengthen lower-ranked indicators through targeted strategies that improve efficiency, responsiveness, and customer experience.
3. Institutionalize customer-centric and data-driven decision-making processes to support continuous improvement.
4. Improve operational efficiency, service reliability, and service consistency through technology integration and workforce development.
5. Enhance customer satisfaction, loyalty, and retention by delivering consistent, high-quality, and personalized service experiences.
6. Establish a sustainable framework that enables the restaurant to adapt to changing market trends, customer expectations, and technological developments from 2026 to 2027.
Sub-problem No. 7. How acceptable is the proposed competitive advantage plan?
| Indicators | Restaurant Managers | Staff | Customers | Composite | Rank | ||||
| WM | VI | WM | VI | WM | VI | WM | VI | ||
| The proposed plan is aligned with the restaurant’s vision, mission, and strategic goals. | 5.00 | HA | 4.69 | HA | 4.70 | HA | 4.80 | HA | 1 |
| The plan is feasible and practical to implement given the restaurant’s available resources. | 4.92 | HA | 4.66 | HA | 4.36 | HA | 4.65 | HA | 5 |
| The proposed strategies can effectively strengthen the restaurant’s market position. | 4.83 | HA | 4.68 | HA | 4.79 | HA | 4.77 | HA | 2 |
| The plan is financially viable and expected to yield positive business outcomes. | 4.75 | HA | 4.66 | HA | 4.71 | HA | 4.71 | HA | 3.5 |
| The proposed initiatives are acceptable to both management and employees. | 4.75 | HA | 4.58 | HA | 4.46 | HA | 4.60 | HA | 6 |
| The plan is responsive to customer needs and current industry trends. | 4.92 | HA | 4.77 | HA | 4.45 | HA | 4.71 | HA | 3.5 |
| Overall Weighted Mean | 4.86 | HA | 4.67 | HA | 4.58 | HA | 4.70 | HA |
Legend:
Range Scale Verbal Interpretation Symbol
54.20-5.00Highly Acceptable HA
43.40-4.19Acceptable A
32.60-3.39Moderately Acceptable MA
21.80-2.59Least Acceptable LA
11.00-1.79Very Least Acceptable VLA
As presented in Table 26, the assessment of the acceptability of the proposed competitive advantage plan is rated as Highly Acceptable with an overall weighted mean of 4.70. All items rated as Highly Acceptable, namely: the proposed plan is aligned with the restaurant’s vision, mission, and strategic goals with a composite weighted mean of 4.80 as rank 1; the proposed strategies can effectively strengthen the restaurant’s market position with a composite weighted mean of 4.77 as rank 2; the plan is financially viable and expected to yield positive business outcomes; and the plan is responsive to customer needs and current industry trends with both the composite weighted mean of 4.71 as rank 3 and 4; the plan is feasible and practical to implement given the restaurant’s available resources with a composite weighted mean of 4.65 as rank 5; and the proposed initiatives are acceptable to both management and employees with a composite weighted mean of 4.60 as rank 6.
As to assessments of the groups of respondents on the acceptability of the proposed competitive advantage plan rated as Highly Acceptable, such as: restaurant managers with an overall weighted mean of 4.86, staff with an overall weighted mean of 4.67, and customers with an overall weighted mean of 4.58.
The high degree of consistency between the assessments of managers, staff, and customers implies a unified operational reality across fast-casual dining establishments. When leadership, front-line personnel, and guests all rate digital innovation and service quality at identically high levels, it shows that strategic corporate goals are successfully reaching the customer. Conversely, the minor variation in which customers score certain metrics slightly lower reveals a subtle perception gap: while internal teams evaluate their service based on operational effort and technical design, customers judge the final experience purely on real-time convenience and personal interactions on the floor.
The high acceptability of the proposed competitive advantage plan is supported by Anderson (2024), who highlights that strategic plans integrating digital innovation with operational realities tend to be more acceptable among restaurant stakeholders when they are practical, financially sound, and responsive to current market trends.
Summary, Conclusions and Recommendations
Summary
The following are the findings of the specific problems raised in the study:
1. On the assessment of restaurant managers, staff, and customers as to the Digital Innovation of Selected Fast Casual Restaurants.
Digital innovation among the selected fast-casual restaurants is assessed as Highly Evident, with a grand mean of 4.65.
2. On the significant difference in the assessment of restaurant managers, staff, and customers as to the Digital Innovation of Selected Fast Casual Restaurants.
The comparative assessment of digital innovation at a 0.05 significance level revealed significant differences among restaurant managers, staff, and customers in their assessments of online ordering systems, mobile app features, and loyalty program automation, leading to the rejection of the null hypothesis in these areas. However, no significant differences were found in their evaluation of integration with third-party delivery platforms, data analytics usage, and contactless payment solutions. Despite these initial differences, post-hoc tests showed that pairwise comparisons among the three groups were not significant, indicating that overall perceptions of digital innovation are generally aligned across managers, staff, and customers.
3. On the Assessment of the Service Quality of Selected Fast Casual Restaurants.
Service quality is assessed as Excellent with a grand mean of 4.65.
-
On the significant relationship between digital innovation and service quality of selected fast casual restaurants?
There is a very strong to perfect positive relationship between digital innovation and service quality in the selected fast-casual restaurants. All service quality indicators—responsiveness, reliability, tangibles, assurance, empathy, and handling of complaints—showed correlation coefficients (r-values) between 0.99 and 1.00, with corresponding t-values exceeding the critical value. This leads to rejection of the null hypothesis and indicates that enhancements in digital innovation are closely linked to improvements in all aspects of service quality.
4. On the problems encountered in terms of digital innovation and service quality.
The problems encountered regarding digital innovation and service quality are assessed as Very Least Encountered, with an overall weighted mean of 1.53.
-
On the findings, the competitive advantage plan was proposed.
The proposed competitive advantage plan comprises key areas, objectives, strategy, activities, and a time frame from August 2026 to July 2027, along with a budget and performance indicators.
5. On the acceptability of the proposed competitive advantage plan.
The proposed competitive advantage plan is assessed as Highly Acceptable with an overall weighted mean of 4.70.
-
Top of Form
-
Bottom of Form
Conclusions
Based on the findings of the study, the following conclusions are drawn:
6.Digital innovation in the selected fast casual restaurants is strongly observed, with online ordering systems leading, followed by contactless payments, mobile app features, loyalty programs, and delivery integration and data analytics.
7. Managers, staff, and customers showed similarities and some variations in their assessment of digital innovation, particularly in online ordering systems, mobile app features, and loyalty program automation, while they generally share aligned perceptions on integration with third-party delivery platforms, data analytics usage, and contactless payment solutions.
8 Service quality is rated very positively overall, led by assurance, followed by tangibles and handling of complaints, then empathy, responsiveness, and reliability of service delivery, with consistently positive assessments from restaurant managers, staff, and customers.
9. Digital innovation and service quality are closely and significantly related, as all service quality dimensions, such as responsiveness, reliability, tangibles, assurance, empathy, and handling of complaints, show very strong to near-perfect relationships.
10. Problems in digital innovation and service quality are rarely encountered, with issues such as inconsistent digital payments, system glitches, and limited app usability being the most noted, while other concerns like staff response, order accuracy, facility upkeep, delivery delays, data use, rewards system errors, staff competence, and complaint handling are least observed across all groups.
11. The proposed competitive advantage plan aims to strengthen and sustain digital innovation and service quality through technology, data-driven systems, workforce development, and customer-focused strategies to improve operations, customer satisfaction, and long-term competitiveness.
12. The proposed competitive advantage plan is rated as highly acceptable, particularly due to its alignment with the restaurant’s vision, mission, and goals, its potential to strengthen market position, financial viability, responsiveness to customer needs and industry trends, feasibility, and acceptability among restaurant managers, staff, and customers.
Recommendations
Based on the findings and conclusions presented, the following recommendations are suggested:
1. Restaurant managers, IT department, and operations team may continuously enhance digital innovation by prioritizing improvements in online ordering systems, contactless payments, mobile app features, loyalty programs, delivery integration, and data analytics to sustain strong performance.
2. Management, IT department, marketing team, and operations staff, consider standardizing and aligning digital innovation practices while addressing variations in perceptions through training, system integration, and consistent technology utilization across all platforms.
3. The restaurant management, operations team, and human resource department can maintain and further improve service quality by strengthening assurance, tangibles, complaint handling, empathy, responsiveness, and reliability through continuous training and service monitoring.
4. Top management, IT department, and quality assurance team may integrate digital innovation initiatives with service quality improvement strategies to sustain and enhance their strong positive relationship through data-driven decision-making and technology optimization.
5. Operations team, IT department, customer service unit, and finance department, consider minimizing remaining issues in digital innovation and service quality by strengthening system reliability, improving app usability, enhancing staff responsiveness, and ensuring efficient complaint and payment handling.
6. Top management, IT department, marketing department, and human resource department may implement the proposed competitive advantage plan by reinforcing digital transformation, workforce capability, customer-focused strategies, and data-driven operations to improve performance and competitiveness.
7. Top management, planning committee, and concerned departments may adopt and implement the highly acceptable competitive advantage plan by ensuring alignment with organizational goals, strengthening market position, and sustaining financial and operational viability through coordinated execution.
8. Future researchers, academic institutions, and hospitality industry practitioners should consider conducting further studies to explore other factors affecting digital innovation and service quality in fast casual restaurants, focusing on broader locations, larger samples, and emerging technologies to deepen understanding and enhance the applicability of findings.
References
- Agresti, A. (2021). Statistical methods for the social sciences (6th ed.). Pearson. DOI ↗ Google Scholar ↗
- Bharadwaj, A. (2021). Digital transformation as a macro architectural force: Evolving models in competitive business spaces. Harvard Business Review Press. Google Scholar ↗
- David, F. R. (2022). Strategic management: Concepts and cases (17th ed.). Pearson. Google Scholar ↗
- Davis, F. D. (1989). Perceived usefulness, perceived ease of use, and user acceptance of information technology. MIS Quarterly, 13(3), 319–340. DOI ↗ Google Scholar ↗
- Gibson, K. (2023). Inclusive hospitality models: Adapting service architectures and soft-skills for diverse demographic segments. Routledge. Google Scholar ↗
- Kwon, D. (2023). Structural system trust and encryption requirements in modernized service frameworks. Academic Press. DOI ↗ Google Scholar ↗
- Laudon, K. C., & Laudon, J. P. (2023). Management information systems: Managing the digital firm (17th ed.). Pearson. Google Scholar ↗
- Sekaran, U., & Bougie, R. (2021). Research methods for business: A skill-building approach (8th ed.). Wiley. Google Scholar ↗
- Smith, L. (2021). Global food service modernization: Standardizing front-end digital transactional touchpoints for corporate market reach. Kogan Page. Google Scholar ↗
- Triola, M. F. (2021). Elementary statistics (13th ed.). Pearson. Google Scholar ↗
- Al-Emran, M., & Granić, A. (2022). Automated loyalty systems in digital service environments: Enhancing customer retention and engagement. Journal of Digital Marketing and Loyalty, 15(2), 45–60. DOI ↗ Google Scholar ↗
- Alzoubi, H., Alharbi, F., & Alshathry, A. (2020). The role of service quality in customer satisfaction and loyalty: Evidence from the restaurant industry. International Journal of Business and Management, 15(6), 45–58. DOI ↗ Google Scholar ↗
- Alzoubi, H., & Yanamandra, S. (2022). Strategic alignment and stakeholder acceptance in service industries. International Journal of Service Management, 33(4), 112–129. Google Scholar ↗
- Alvarez, M. G. (2023). Architectural forces in hospitality: Structural interdependence of digital innovation frameworks and service excellence in Philippine urban commercial hubs. Philippine Journal of Business Administration, 29(1), 74–91. Google Scholar ↗
- Anderson, P. (2024). Strategic importance of third-party delivery integration in North American fast casual restaurants. Journal of Hospitality and Operations, 38(1), 78–93. Google Scholar ↗
- Bautista, R. J. (2022). Concrete execution over automated updates: Isolating primary pillars of service reliability and customer retention in Philippine quick-service settings. Journal of Culinary and Service Operations, 14(3), 112–128. Google Scholar ↗
- Bianchi, M. (2021). Immersive mobile applications in the Italian dining market: Trends and customer engagement. European Journal of Hospitality Digitalization, 9(3), 22–37. Google Scholar ↗
- Carranza, L. (2024). Competitive advantage through digital–human alignment in fast casual dining. Journal of Restaurant Management, 27(2), 101–117. Google Scholar ↗
- Chen, C. (2023). Data analytics driving operational excellence in global fast casual restaurants. International Journal of Foodservice Technology, 20(4), 210–228. Google Scholar ↗
- Chen, W., Zhang, L., & Lee, S. (2022). Effects of digital ordering platforms on food service speed and satisfaction. Journal of Service Innovation, 18(2), 140–155. Google Scholar ↗
- Cruz, J. (2023). Digital innovation strategies in fast casual restaurants: Aligning business workflows with the modern Filipino consumer demographic. Philippine Journal of Foodservice Management, 19(2), 45–58. Google Scholar ↗
- Evans, T. (2023). Reliability in digital restaurant service platforms: Foundations of customer trust. International Journal of Service Technology, 14(3), 199–215. Google Scholar ↗
- Fernandez, P. (2022). Operationalizing floor patches into systematic CRM follow-ups: Service recovery trends in Manila’s casual dining centers. Journal of Hospitality Culture, 8(2), 101–118. Google Scholar ↗
- Johnson, M. (2022). Mobile applications and customer experience in developed economies' fast casual dining. International Journal of Hospitality and Tourism Technology, 7(1), 88–104. Google Scholar ↗
- Kim, H. (2020). Digital complaint management challenges in South Korean fast casual restaurants. Journal of Asian Food Service, 12(3), 63–79. Google Scholar ↗
- Kim, J., & Lee, S. (2023). Mobile application features and customer loyalty: Evidence from Korean fast casual restaurants. Journal of Digital Marketing in Hospitality, 6(2), 54–70. Google Scholar ↗
- Kim, J., & Lee, Y. (2024). Influence of physical and digital touchpoints on customer satisfaction in restaurant operations. International Journal of Hospitality Service Design, 11(1), 75–90. Google Scholar ↗
- Kim, S., & Park, J. (2021). Fast casual dining trends and customer behavior analysis. Food Service Research Journal, 24(3), 210–225. Google Scholar ↗
- Kumar, S. (2024). AI-driven recommendation systems and customer loyalty in Indian fast casual restaurants. Journal of Service Innovation and AI, 5(1), 101–120. Google Scholar ↗
- Lemon, K. N., & Verhoef, P. C. (2021). Understanding customer experience throughout the customer journey. Journal of Marketing Theories, 85(1), 12–32. Google Scholar ↗
- Lin, Y., & Lin, C. (2020). Reliability and service quality: An empirical study in fast food restaurants. Service Industries Journal, 40(13–14), 935–953. DOI ↗ Google Scholar ↗
- Mangahas, E. (2022). Mobile application functionalities inside the Philippine foodservice market: Bridging brand aesthetics with immediate transaction capabilities. Asia-Pacific Journal of Hospitality Innovation, 11(4), 112–126. Google Scholar ↗
- Nguyen, T., & Simkin, L. (2023). Data-driven marketing in food service: Exploring analytics application and customer personalization. Journal of Marketing Analytics, 11(2), 123–136. DOI ↗ Google Scholar ↗
- Parasuraman, A., Zeithaml, V. A., & Berry, L. L. (1991). Refinement and reassessment of the SERVQUAL scale. Journal of Retailing, 67(4), 420–450. Google Scholar ↗
- Patel, N. (2022). Contactless Catalysts: Optimizing counter-level processing velocities and table turnover via electronic transaction loops. McGraw-Hill Education. Google Scholar ↗
- Reyes, T., & Santos, J. (2023). Stakeholder satisfaction disparities in automated service environments: Disjointed platform designs and front-line labor stress in domestic casual food environments. Philippine Academy of Management Journal, 6(1), 89–104. Google Scholar ↗
- Santos, K. M. (2022). Navigating frontline friction: Measuring the direct correlation between workforce ongoing training and customer assurance marks. Journal of Hospitality Management and Capital, 17(2), 145–160. Google Scholar ↗
- Schallmo, D., & Williams, C. (2024). Digital transformation frameworks: Automation and augmentation in the modern service firm. Springer Business Media. Google Scholar ↗
- Thomas, E. (2023). Psychological validation in transaction crises: Empathetic customer relationship management and face-to-face service recovery loops. Wiley. Google Scholar ↗
- Venkatesh, V. (2021). Technology acceptance models in modern service spaces: Interface clarity as a prerequisite for sustained user adoption. MIS Quarterly, 45(2), 312–330. Google Scholar ↗
- Vial, G. (2023). Digital optimization boundaries: Strategic alignment of automated pipelines and human hospitality touchpoints. Journal of Strategic Information Systems, 32(1), 101–119. Google Scholar ↗
- Villanueva, S. (2023). Payment gateway instabilities and frontline operational stress: Analyzing electronic terminal failures in casual dining networks. Philippine Journal of Technology Management, 15(2), 56–73. Google Scholar ↗
- Wang, C., & Ahmed, P. K. (2022). Digital innovation and competitive advantage: A review and future research agenda. Technological Forecasting and Social Change, 176, Article 121442. DOI ↗ Google Scholar ↗
Appendix
Proposed Competitive Advantage Plan
Introduction
The proposed Competitive Advantage Plan is based on findings that both the Digital Innovation and Service Quality dimensions in selected fast-casual restaurants are consistently rated as highly evident and excellent by restaurant managers, staff, and customers. These results indicate that the establishments already possess strong operational capabilities and customer-oriented practices that contribute to their current market performance. However, in an increasingly competitive and technology-driven food service industry, maintaining these high levels of performance requires continuous improvement, innovation, and sustainability-focused strategies.
Thus, the plan is designed not only to address minor gaps identified in lower-ranked indicators but, more importantly, to sustain and strengthen existing best practices that support long-term competitiveness.
Rationale
The rationale for the proposed plan is anchored on the need to transform strong performance outcomes into sustainable competitive advantages. While the findings reveal that digital systems (e.g., online ordering, mobile applications, contactless payments, and data analytics) and service quality dimensions (e.g., responsiveness, reliability, assurance, empathy, tangibles, and complaint handling) are already well-established, sustaining these requires systematic planning, resource allocation, and continuous monitoring. Moreover, the dynamic nature of customer expectations, technological advancements, and market competition necessitates proactive strategies to ensure that service excellence and innovation are consistently delivered. The plan, therefore, focuses on reinforcing strengths, enhancing lower-ranked areas, and integrating data-driven and customer-centric approaches to maintain long-term business success.
Objectives
The proposed Competitive Advantage Plan aims to:
-
Sustain and enhance the current high levels of digital innovation and service quality across all operational areas of the restaurant.
-
Strengthen lower-ranked indicators through targeted strategies that improve efficiency, responsiveness, and customer experience.
-
Institutionalize customer-centric and data-driven decision-making processes to support continuous improvement.
-
Improve operational efficiency, service reliability, and service consistency through technology integration and workforce development.
-
Enhance customer satisfaction, loyalty, and retention by delivering consistent, high-quality, and personalized service experiences.
-
Establish a sustainable framework that enables the restaurant to adapt to changing market trends, customer expectations, and technological developments from 2026 to 2027.
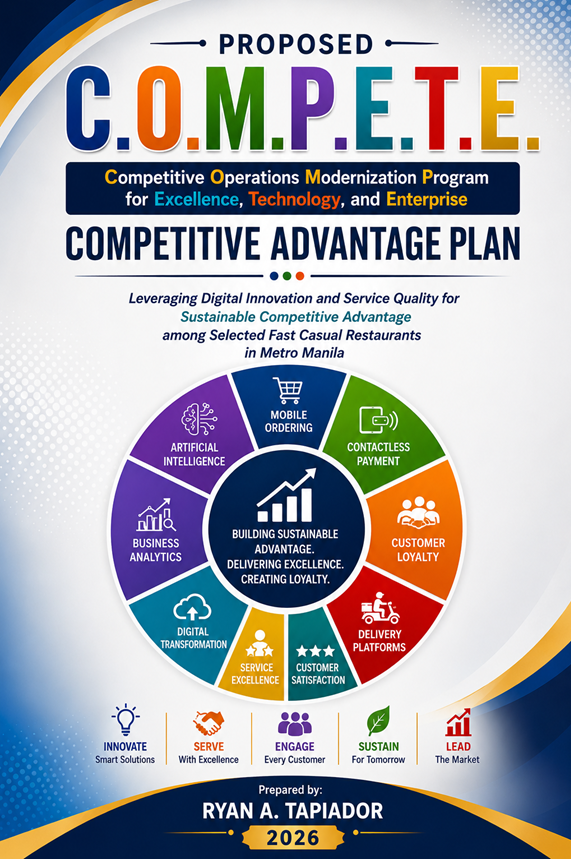
A. Digital Innovation of Selected Fast Casual Restaurants
| Key Result Areas | Objective | Strategy | Activities | Department Responsible | Time Frame | Budget | Performance Indicators |
| Data Analytics Usage | Achieve accurate demand forecasting and reduce stock issues | Implement simple AI forecasting tool | Assess current inventory management Adopt affordable forecasting software Train operations staff on usage | Operations Department IT Department Supply Chain Unit | Aug 1 – Sept 15, 2026 | ₱300,000 (software, training, implementation) | 90% forecasting tool adoption and usage |
| Automate sales reporting to support timely, accurate decisions | Use existing POS data with basic analytics tools | Setup dashboards Train supervisors Weekly sales review | Finance Department Operations Department IT Department | Aug 1 – Sept 7, 2026 & ongoing | ₱100,000 (dashboard setup, training, monitoring) | 95% timely sales reports generated | |
| Increase engagement through personalized marketing | Use CRM features in affordable platforms | Segmentation data gathering Marketing team training Launch campaigns | Marketing Department IT Department | Aug 1 – Oct 31, 2026 | ₱150,000 (CRM subscription, campaigns, training) | 90% targeted campaign delivery | |
| Enhance personalization via ongoing customer feedback | Use simple feedback collection tools | Deploy feedback tools Staff training Analyze feedback monthly | Customer Relations Department, IT Department | Aug 1 – Dec 31, 2026 | ₱200,000 (feedback tools, data analysis, training) | 95% customer feedback collected and analyzed monthly | |
| Sustain high customer satisfaction via real-time feedback | Implement user-friendly digital feedback system | Install digital feedback terminals Incentivize customer participation Track and report satisfaction trends | Customer Relations Department Marketing Department IT Department | Aug 1 – Dec 31, 2026 | ₱250,000 (hardware/software, reporting, incentives) | 95% customer feedback participation | |
| Integrate analytics into management for fast, accurate decisions | Use centralized Business Intelligence dashboards | Build centralized BI dashboards Train managers on dashboard use Conduct monthly decision review meetings | Top Management, IT Department, All Functional Departments | Aug 1 – Dec 31, 2026 | ₱200,000 (BI software, training, meeting facilitation) | 95% dashboard usage | |
| Increase profitability with data-driven menu & pricing updates | Adopt affordable AI menu analytics | Setup menu performance tracking analytics Train staff on menu data use Conduct quarterly pricing reviews | Operations Department, Marketing Department, Finance Department, IT Department | Aug 1 – Nov 30, 2026 | ₱300,000 (analytics software, training, reviews) | 100% completion of quarterly menu & pricing reviews | |
| Integration with Third-Party Delivery Platforms | Strengthen real-time coordination with delivery partners. | Establish a rider coordination system | Develop rider coordination protocols Implement real-time communication tools Assign liaison officers and hold monthly coordination meetings | Operations Department, Logistics Unit, IT Department | Aug 1 – Oct 31, 2026 | ₱200,000 (protocol, software, staffing) | 95% system operational with liaison officers assigned |
| Automate and streamline order management | Integrate POS with delivery platforms | Integrate POS with delivery apps Train staff on system Implement order verification process | IT Department, Operations Department, Service Crew | Aug 1 – Nov 30, 2026 | ₱300,000 (system integration, training, process setup) | 95% POS-to-platform integration completed | |
| Optimize delivery tracking and scheduling | Develop integrated logistics monitoring | Implement GPS tracking Create delivery scheduling Assign monitoring personnel | Logistics Unit, Operations Department, IT Department | Sep 1 – Dec 31, 2026 | ₱400,000 (tracking system, scheduling tools, personnel) | 95% delivery tracking and scheduling system active | |
| Ensure menu consistency | Centralize digital menu management | Create centralized menu database Assign menu manager Synchronize updates with platforms | Marketing Department, IT Department, Operations Department | Aug 1 – Oct 31, 2026 | ₱100,000 (database, training, audits) | 100% menu consistency across platforms | |
| Increase online orders and customer reach | Strengthen marketing partnerships | Launch joint promotions Train marketing on platform ads Analyze market reach | Marketing Department, Business Development Unit | Aug 1, 2026 – Jul 31, 2027 | ₱250,000 (promotions, training, data analysis) | 95% delivery platform promotional campaigns launched | |
| Boost complaint responsiveness and resolution | Implement centralized complaint system | Set up 24/7 complaint response Train staff Monitor complaints weekly | Customer Service Department IT Department | Aug 1 – Nov 30, 2026 | ₱100,000 (system setup, training, monitoring) | 95% complaint response system operational | |
| Sustain strong delivery partner alliances | Formalize agreements and joint initiatives | Review and renew agreements Hold quarterly review meetings Develop joint marketing and SLAs | Top Management, Business Development Unit, Legal Department | Aug 1, 2026 – Jul 31, 2027 | ₱100,000 (agreements, meetings, marketing programs) | 95% partnership agreements evaluated and performance reviewed | |
| Mobile App Features | Enhance app functionality with accurate location services | Integrate advanced GPS mapping system | Integrate GPS mapping into app Update branch geolocation database Train IT team on optimization | Marketing Department Customer Relations Department IT Department | Aug 1 – Dec 31, 2026 | ₱500,000 (GPS integration, database update, training) | 100% GPS feature integration and usage |
| Optimize app performance across all devices | Upgrade system and backend infrastructure | Conduct performance diagnostics Optimize code and backend Perform device compatibility testing | IT Department | Jan 1 – Jul 31, 2027 | ₱500,000 (system upgrades and testing) | 100% stability and compatibility testing completed | |
| Improve access to promotions and personalized discounts | Centralize and automate promotion system | Develop promotion dashboard Integrate personalized notifications Train marketing on app promotion tools | Marketing Department IT Department | Aug 1 – Dec 31, 2026 | ₱300,000 (dashboard development, training, integration) | 95% promotion system operational | |
| Deliver timely, relevant notifications | Implement AI-based notification personalization | Develop AI notification system Segment customer groups Monitor & optimize notification engagement | Marketing Department IT Department | Aug 1 – Dec 31, 2026 | ₱250,000 (AI system development, training, analytics) | 100% AI notification system deployed | |
| Align app design with brand identity | Redesign and test app interface | Redesign interface Conduct UX testing Collect customer feedback for improvements | IT Department Customer Service Department | Aug 1 – Dec 31, 2026 | ₱200,000 (design, testing, feedback analysis) | 95% redesigned and tested UI deployed | |
| Ensure promotions are easily accessible and up-to-date | Integrate real-time promo updates with easy navigation | Simplify promotion navigation Integrate real-time promo updates Train staff on promotion management | IT Department Marketing Department Frontline Staff | Aug 1 – Jul 31, 2027 | ₱350,000 (integration, training, usability testing) | 100% promotion accessibility in app | |
| Continuously improve app UX and streamline reordering | Implement UX audits and AI-based reordering | Conduct quarterly UX audits Enhance one-click reordering Use AI to track user behavior for improvements | Marketing Department IT Department Data Analytics Team | Aug 1, 2026 – Jul 31, 2027 | ₱500,000 (UX audits, development, AI tracking tools) | 100% scheduled UX audits and one-click system active | |
| Loyalty Program Automation | Redesign loyalty mechanics with gamification and incentives | Use behavior-based rewards and engagement features | Analyze customer behavior Launch gamified rewards (levels, badges) Conduct targeted re-engagement campaigns | Marketing Department Customer Relations Department IT Department | Aug 1 – Oct 15, 2026 | ₱300,000 (analysis, gamification, campaign execution) | 95% gamified system launched and operational |
| Stimulate repeat purchase behavior with targeted rewards | Implement AI-based predictive analytics | Analyze purchase patterns Develop reward triggers Launch personalized discount campaigns | IT Department | Aug 1 – Oct 31, 2026 | ₱350,000 (analytics, reward design, campaigns) | 95% predictive analytics integrated | |
| Ensure seamless loyalty experience on app, website, POS | Centralize loyalty system and synchronize points | Upgrade system integration Test compatibility Train staff | Marketing Department IT Department | Jan 16 – Mar 31, 2027 | ₱500,000 (system upgrades, testing, training) | 100% system synchronization and staff traine | |
| Automate messaging on rewards and expiry alerts | Develop AI-driven notification system | Set up automated notifications Customize alerts Track and optimize engagement | Marketing Department IT Department | Apr 1 – Jun 15, 2027 | ₱150,000 (notification system, customization, analytics) | 100% notification system functional | |
| Make loyalty tracking accessible and transparent | Redesign dashboard UI/UX and enable real-time data | Redesign interface Enable real-time tracking Usability testing and staff training | IT Department Customer Service Department | Jun 16 – Jul 31, 2027 | ₱200,000 (UI redesign, testing, training) | 100% dashboard usability achieved | |
| Streamline signup and onboarding process | Automate and enhance digital registration | Simplify registration forms Train frontline staff Monitor and optimize registration rates | IT Department Marketing Department Frontline Staff | Aug 1 – Jul 31, 2027 | ₱150,000 (process automation, training, monitoring) | 100% registration process simplified and automated | |
| Deliver customized rewards to enhance satisfaction | Implement AI-driven personalization engine | Develop AI reward profiling Integrate CRM & loyalty platform Analyze and update rewards quarterly | Marketing Department IT Department Data Analytics Team | Jul 1 – Jul 31, 2027 | ₱200,000 (AI development, integration, analytics) | 95% AI-personalization system implemented | |
| Contactless Payment Solutions | Enhance cybersecurity and awareness for contactless payments | Improve security protocols and customer education | Conduct cybersecurity risk assessment Implement multi-factor authentication Launch customer awareness campaign | IT Department Finance Department Customer Service Unit | Aug 1 – Dec 31, 2026 | ₱400,000 (security upgrades, training, awareness campaigns) | 95% security protocols implemented and awareness conducted |
| Automate and integrate payment verification | Upgrade POS and validation tools | Upgrade POS & QR payment systems Implement real-time transaction validation Train staff & conduct weekly error audit | Finance Department IT Department Operations Department | Aug 1 – Nov 30, 2026 | ₱400,000 (system upgrades, training, audits) | 95% system integration completed | |
| Simplify and speed up payment processes | Optimize payment process integration | Simplify checkout flow Integrate one-tap mobile payments Improve QR code accessibility & monitor satisfaction | Operations Department IT Department | Aug 1 – Dec 31, 2026 | ₱250,000 (process improvements, app integration, training) | 95% checkout process optimized | |
| Upskill staff on contactless and digital payment systems | Continuous training & certifications | Conduct quarterly trainings Develop digital payments manual Implement simulation-based sessions & evaluate performance | Human Resource Department Finance Department IT Department | Aug 1, 2026 – Jul 31, 2027 | ₱100,000 (training programs, manuals, evaluation tools) | 100% staff trained and certified | |
| Expand digital payment access points for customer convenience | Optimize placement and audit accessibility | Install additional QR stations Upgrade payment terminals Conduct branch accessibility audits & gather feedback | Operations Department IT Department | Aug 1 – Dec 31, 2026 | ₱250,000 (devices, audits, feedback tools) | 100% accessibility coverage achieved | |
| Strengthen partnerships & integrate multiple payment options | Collaborate with fintech and payment providers | Maintain fintech partnerships Integrate new digital wallets Conduct quarterly updates & promote payment | Finance Department Business Development Unit | Aug 1, 2026 – Jul 31, 2027 | ₱200,000 (partnerships, integrations, promotions) | 100% payment method availability satisfaction | |
| Optimize payment processing for speed and reliability | Upgrade infrastructure and implement optimization | Upgrade payment processing systems Integrate AI transaction routing Monitor speed & train staff on fast transactions | IT Department Finance Department Operations Department | Aug 1, 2026 – Jul 31, 2027 | ₱400,000 (system upgrades, AI integration, training) | 95% transaction speed and reliability goals met | |
| Online Ordering System | Improve order visibility and customer satisfaction | Upgrade tracking infrastructure | Integrate GPS & order tracking Upgrade backend system Train staff & test per branch | IT Department Operations Department | Aug 1 – Dec 31, 2026 | ₱100,000 (systems, training, testing) | 95% tracking system integrated and operational |
| Maintain system uptime & uninterrupted online ordering | Strengthen servers and maintenance. | Upgrade server & cloud capacity Perform weekly maintenance Train IT troubleshooting & monitor downtime | IT Department | Aug 1 – Dec 31, 2026 | ₱200,000 (infrastructure upgrade, maintenance, training) | 95% uptime with preventive maintenance implemented | |
| Keep online menu accurate and consistent | Centralize and synchronize menu management | Develop digital menu database Assign menu control officer Conduct monthly audits and staff training | Marketing Department IT Department Operations Department | Aug 15 – Dec 31, 2026 | ₱100,000 (database, audits, training) | 95% menu accuracy with zero customer complaints | |
| Ensure customers get timely and accurate notifications | Upgrade automated communication system | Upgrade notification system Integrate multi-channel alerts Monitor notifications and gather feedback | IT Department Customer Service Department | Aug 1 – Dec 15, 2026 | ₱200,000 (system upgrade, training, monitoring) | 95% on-time notifications delivered | |
| Improve customer control with personalized options | Enrich customization and UI/UX | Expand customization features Improve UI/UX design Conduct user testing and staff training | IT Department Marketing Department | Aug 15 – Dec 31, 2026 | ₱150,000 (development, UX design, testing) | 95% customization features implemented | |
| Maintain intuitive and simple online ordering | Continuous usability enhancements | Conduct quarterly usability tests Simplify navigation Implement one-click ordering and collect feedback | IT Department Customer Experience Unit | Aug 1, 2026 – Jul 31, 2027 | ₱200,000 (testing, UI improvements, feedback analysis) | 95% usability satisfaction | |
| Speed up and streamline order processing | Implement AI-based routing & integration | Implement AI order routing Integrate POS with kitchen displays Train staff and monitor performance | Operations Department IT Department Kitchen Operations Unit | Sep 1, 2026 – Jul 31, 2027 | ₱250,000 (AI tools, integration, training) | 95% AI-assisted order routing operational |
B. Service Quality of Selected Fast Casual Restaurants
| Key Result Areas | Objective | Strategy | Activities | Department Responsible | Time Frame | Budget | Success Indicators |
| Responsiveness to Customer Requests | Improve staff attentiveness and response during peaks | Optimize workforce and enhance peak-hour service | Analyze peak-hour staffing needs Adjust shifts with workforce augmentation Train staff on multitasking & queue management | Human Resource Department Operations Department | Aug 1 – Nov 30, 2026 | ₱100,000 (staffing analysis, training, queue systems) | 95% peak-hour responsiveness system implemented |
| Enhance responsiveness across digital & traditional | Implement integrated customer response management | Set up inquiry platform Staff communication training Launch 24/7 chat support | Customer Service Department IT Department | Aug 15 – Dec 31, 2026 | ₱100,000 (platform setup, training, chat support) | 95% customer inquiry response system operational | |
| Foster proactive customer assistance | Continuous training and motivation | Conduct service excellence training Implement rewards Evaluate staff engagement | Human Resource Department Operations Department | Sep 1 – Dec 31, 2026 | ₱150,000 (training, reward program, evaluations) | 95% staff engagement initiative launched | |
| Improve order processing speed and accuracy | Digitally integrate POS and kitchen order systems | Upgrade POS-kitchen integration Train on accuracy Implement verification audits | Operations Department IT Department | Aug 1 – Nov 30, 2026 | ₱150,000 (system upgrade, training, audits) | 90% accurate order processing | |
| Promote customer-first service attitude | Institutionalize service values and recognition | Conduct service values training Implement recognition Use feedback for evaluations | Human Resource Department | Aug 1, 2026 – Jul 31, 2027 | ₱150,000 (training, recognition, feedback systems) | 95% customer-first service culture institutionalized | |
| Improve complaint handling and resolution | Real-time resolution & escalation system setup | Establish rapid response unit Train staff on problem-solving Monitor resolution & escalations | Customer Service Department Operations Department | Aug 1 – Jul 31, 2027 | ₱200,000 (unit setup, training, tracking system) | 98% complaints resolved within 24 hours | |
| Ensure reliable, fast service delivery | Use digital monitoring and AI-assisted tracking | Implement service dashboard Train rapid response Monitor and reward top performers | Operations Department IT Department Customer Service Unit | Sep 1, 2026 – Jul 31, 2027 | ₱300,000 (dashboard, training, AI tools, rewards) | 95% service responsiveness monitoring implemented | |
| Reliability of Service Delivery | Enhance time management and kitchen workflow efficiency | Optimize process workflow and real-time monitoring | Conduct time-motion study Implement order monitoring system Train staff on time efficiency standards | Operations Department Kitchen Operations Unit | Aug 1 – Dec 31, 2026 | ₱100,000 (study, system, training) | 95% on-time delivery monitoring operational |
| Improve communication of delivery commitments | Standardize service promise and integrate tracking | Standardize communication scripts Integrate tracking updates Train staff and gather feedback | Customer Service Department Operations Department | Aug 15 – Dec 31, 2026 | ₱150,000 (communication, training, feedback) | 95% service promise communication standard implemented | |
| Ensure consistent service during peak demand | Balance workload and optimize staffing | Analyze peak-hour patterns Implement flexible staffing Deploy queue management & train staff | Human Resource Department Operations Department | Aug 1 – Nov 30, 2026 | ₱100,000 (analysis, staffing, queue system) | 95% peak-hour staffing and queue management active | |
| Standardize recipes and quality control | Strengthen quality control and training | Develop standard recipes Conduct quality audits Train kitchen staff and monitor supplier quality | Kitchen Operations Unit Quality Assurance Department | Aug 1, 2026 – Jul 31, 2027 | ₱100,000 (standards, audits, training) | 100% food quality control system in place | |
| Implement integrated order verification systems | Upgrade POS and implement double-verification | Upgrade POS/kitchen integration Train staff on order accuracy Conduct regular order audits | IT Department Operations Department | Aug 1, 2026 – Dec 31, 2026 | ₱250,000 (system upgrade, training, audits) | 95% order verification system operational | |
| Improve operational scalability and workforce flexibility | Implement dynamic staffing and workload balancing | Implement flexible staffing Develop surge capacity plan Train staff for multi-roles | Operations Department Human Resource Department | Aug 1, 2026 – Jul 31, 2027 | ₱100,000 (staffing system, planning, training) | 95% dynamic staffing and surge plan established | |
| Use AI and automation to maintain order accuracy | Maintain advanced order management and monitoring | Implement AI verification Integrate POS/kitchen display Train staff on precise order handling | Operations Department Human Resource Department | Sep 1, 2026 – Jul 31, 2027 | ₱200,000 (AI tools, system integration, training) | 95% AI-assisted order accuracy monitoring functional | |
| Empathy | Improve staff patience & emotional intelligence | Continuous behavioral and emotional intelligence training | Conduct EI and customer handling training Implement stress management workshops Role-playing and feedback monitoring | Human Resource Department Customer Service Department | Aug 1 – Dec 31, 2026 | ₱100,000 (training, workshops, feedback system) | 95% staff empathy training and evaluation implemented |
| Establish structured feedback management system | Digital collection, staff training, and resolution | Implement digital feedback tools Conduct monthly feedback reviews Train staff & monitor resolution | Customer Service Department IT Department | Aug 15 – Dec 31, 2026 | ₱100,000 (feedback systems, training, CRM integration) | 90% feedback response system operational | |
| Recognize repeat customers and preferences | Integrate CRM with loyalty systems | Develop customer preference database Integrate CRM-loyalty Train staff and monitor satisfaction | Marketing Department IT Department Customer Relations Unit | Aug 1 – Dec 31, 2026 | ₱100,000 (CRM integration, training, monitoring | 95% CRM-loyalty integration and staff trained | |
| Institutionalize appreciation & engagement programs | Campaigns, recognition, and management involvement | Launch appreciation campaigns Implement recognition programs Conduct management customer walkthroughs | Top Management Marketing Department | Aug 1, 2026 – Jul 31, 2027 | ₱150,000 (campaigns, recognition, events) | 95% customer appreciation programs running | |
| Reinforce customer-centric culture | Regular training and service quality monitoring. | Conduct service excellence training Monitor service quality Recognize outstanding service | Human Resource Department Operations Department | Aug 1, 2026 – Jul 31, 2027 | ₱100,000 (training, monitoring, recognition) | 95% customer-centric culture institutionalized | |
| Foster diversity and accessibility | Staff training and environment adaptation | Conduct inclusivity training Improve physical accessibility Monitor inclusivity and gather feedback | Human Resource Department Operations Department Marketing Department | Aug 1, 2026 – Jul 31, 2027 | ₱100,000 (training, facility improvements, monitoring | 90% inclusivity training completed and feedback positive | |
| Sustain excellent service and accessibility | Specialized facilities, staff training, advocacy | Install PWD-friendly facilities Train staff on special needs Regular accessibility audits and partnerships | Operations Department Human Resource Department Customer Service Unit | Aug 1, 2026 – Jul 31, 2027 | ₱100,000 (facilities, training, audits) | 95% accessibility standards compliance achieved | |
| Tangibles | Redesign space for efficient customer and staff movement | Analyze flows and test layout redesign | Conduct space & flow analysis Redesign dining & service layout Pilot test adjustments during peak hour | Operations Department Facilities Management Unit | Aug 1 – Nov 15, 2026 | ₱250,000 (analysis, redesign, pilot testing) | 95% layout optimized and congestion reduced |
| Upgrade interior design aligned with customer preferences | Conduct surveys and improve environmental elements | Conduct ambiance surveys Upgrade lighting, ventilation, sound Implement seasonal theme | Marketing Department Operations Department | Aug 1, 2026 – Jul 31, 2027 | ₱200,000 (survey, upgrades, thematic design) | 95% ambiance upgraded with positive feedback | |
| Enforce uniform policy and grooming standards | Standardize and monitor appearance | Standardize uniform guidelines Daily appearance checks Train staff & recognize best-groomed | Human Resource Department Operations Department | Aug 1 – Dec 31, 2026 | ₱100,000 (uniforms, training, recognition) | 100% uniform policy compliance | |
| Implement sanitation protocols and monitor compliance | Standardize cleaning and conduct regular audits | Establish cleaning procedures Hourly sanitation checks Staff training and weekly audits | Operations Department Quality Assurance Unit | Aug 1 – Dec 31, 202 | ₱200,000 (cleaning protocols, audits, training) | 100% sanitation protocol adherence | |
| Upgrade and maintain digital infrastructure and equipment | Conduct regular maintenance and staff training | Maintain kiosks & screens Upgrade equipment Train staff and monitor functionality | IT Department Operations Department | Aug 1 – Dec 31, 2026 | ₱200,000 (maintenance, upgrades, training) | 95% digital system uptime maintained | |
| Update branding and maintain visual appeal | Redesign and regularly update materials | Redesign menus & displays Update promo materials Train staff on displays | Marketing Department Creative Team | Aug 1 – Dec 31, 2026 | ₱250,000 (design, updates, training) | 100% branding consistency maintained | |
| Implement cleanliness management and monitoring | Real-time monitoring and staff accountability | Implement cleanliness checklists Assign sanitation leads. Conduct surprise audits & reward staff | Operations Department Quality Assurance Unit | Aug 1 – Dec 31, 2026 | ₱100,000 (monitoring, personnel, audits, rewards) | 95% cleanliness standards maintained | |
| Handling of Complaints | Establish structured post-resolution follow-up system | Automate messaging & train staff | Develop automated follow-up messaging Create follow-up timeline Train staff; monitor compliance | Customer Service Department IT Department | Aug 1 – Nov 30, 2026 | ₱200,000 (automation, training, monitoring) | 95% follow-up system operational |
| Digitize and clarify complaint handling process | Publish guidelines, integrate multiple channels | Develop process guidelines Integrate complaint system in app/website Staff training & monitor access | Customer Service Department IT Department | Sep 1 – Dec 31, 2026 | ₱100,000 (guidelines, digital platform, training) | 95% accessible, standardized complaint system | |
| Implement real-time escalation and resolution | Create matrices and issue tracking | Establish escalation matrix Train staff problem-solving Deploy tracking dashboard; monitor turnaround | Operations Department Customer Service Department | Aug 15 – Dec 31, 2026 | ₱100,000 (protocols, training, system deployment) | 95% real-time issue escalation system functional | |
| Integrate complaint data in management decision-making | Build dashboards & train managers | Develop analytics dashboard Monthly trend analysis Manager training & quarterly impact evaluation | Top Management IT Department Quality Assurance Unit | Jan 1 – Jul 31, 2027 | ₱100,000 (analytics, training, evaluations) | 95% complaint analytics dashboard operational | |
| Promote customer-centric mindset through training | Behavioral training with recognition | Conduct service & conflict management training Implement recognition programs Role playing and monitoring | Human Resource Department Customer Service Department | Jan 1 – Jul 31, 2027 | ₱100,000 (training, recognition, monitoring) | 95% customer-centric behavior reinforced | |
| Maintain digital complaint management and staff training | Real-time monitoring and audits | Launch real-time complaint monitoring. Train communication & resolution Conduct audits & reward staff | Customer Service Department Operations Department | Jan 1 – Jul 31, 2027 | ₱100,000 (system, training, audits) | 95% efficient complaint handling system implemented | |
| Develop listening skills as core competency | Training, evaluation, and recognition | Active listening training Customer interaction evaluations Recognize excellent listeners | Human Resource Department Customer Service Department | Jan 1 – Jul 31, 2027 | ₱100,000 (training, evaluation, recognition) | 90% active listening practice institutionalized | |
| Assurance | Strengthen product knowledge and info dissemination systems | Staff training, standardized guides, digital menus | Conduct product knowledge training Develop menu guides Integrate digital visuals | Operations Department Marketing Department Human Resource Department | Aug 1 – Oct 31, 2026 | ₱250,000 (training, materials, digital content) | 100% staff trained; info accuracy ensured |
| Enhance food safety management and facilitate compliance | Training, audits, equipment upgrades | Conduct food safety certification training Perform regular hygiene audits Upgrade sanitation systems | Quality Assurance Department Operations Department | Aug 1 – Dec 31, 2026 | ₱200,000 (training, audits, equipment upgrades) | 100% compliance with health standards | |
| Reinforce excellent service culture | Training, behavior monitoring, recognition | Conduct customer service & etiquette training Implement behavior evaluation Recognize exemplary staff | Human Resource Department Customer Service Department | Aug 1 – Nov 30, 2026 | ₱100,000 (training, evaluation, recognition) | 95% staff behavior meets standards | |
| Maintain consistent quality and communication | Trust campaigns, feedback monitoring, engagement. | Launch brand trust campaigns Monitor reviews and feedback Conduct engagement programs | Marketing Department Top Management | Aug 1 – Dec 31, 2026 | ₱100,000 (campaigns, monitoring, engagement) | 95% positive brand perception | |
| Maintain efficient, secure transaction systems | Staff training, system upgrades, security monitoring | Train digital payment protocols Upgrade payment systems Conduct audits and fraud prevention | Finance Department IT Department | Aug 1 – Dec 31, 2026 | ₱100,000 (training, system upgrade, audits) | 95% transaction accuracy and zero fraud | |
| Continuous learning programs to maintain service quality | Regular training, competency assessments, career development | Conduct regular skills training and certification Implement competency assessment programs Provide career development opportunities Monitor staff performance evaluations Recognize high-performing employees | Human Resource Department | Aug 1 – Dec 31, 2026 | ₱250,000 (training, assessment, recognition) | 95% staff competency maintained | |
| Maintain secure, reliable transaction systems | Advanced security systems, audits, customer communication. | Implement payment security systems Conduct security audits Train staff and communicate safety measures | IT Department Finance Department Operations Department | Aug 1 – Dec 31, 2026 | ₱200,000 (security systems, audits, training) | 100% customer safety satisfaction |
Prepared by: Ryan A. Tapiador, MBA©
PERMISSION TO CONDUCT SURVEY
SURVEY QUESTIONNAIRE
Date: ______________
Dear Respondents,
This questionnaire seeks to solicit your opinion and judgement on the “DIGITAL INNOVATION AND SERVICE QUALITY OF SELECTED FAST CASUAL RESTAURANTS IN METRO MANILA: BASIS FOR COMPETITIVE ADVANTAGE PALN”. The information gathered in this survey will be used as baseline information to determine the operations of selected Shakey’s Pizza Restaurant, Kenny Rogers Roasters, Tokyo Tokyo Restautant, Yellow Cab Pizza Co., and BonChon Chicken and identify challenges that need to be addressed for the purpose of coming up with a “INPUTS TO EXPANSION PLAN”. Rest assured that your responses will be treated with the utmost confidentiality and will only be used for the purpose of this study.
Sincerely yours,
RYAN TAPIADOR
Researcher
SURVEY QUESTIONNAIRE
DIGITAL INNOVATION AND SERBVICE QUALITY OF SELECTED FAST CASUAL RESTAURANTS IN METRO MANILA: BASIS FOR COMPETITIVE ADVANTAGE PLAN
SURVEY QUESTIONAIRE
Direction: Please put a check ( ) in the space provided in each question that best fits your answer.
PART 1. DEMOGRAPHIC PROFILE
Name: __________________________________________________________
(Optional)
Fast Casual Restaurant
_____ Shakey’s Pizza Restaurant
_____ Kenny Rogers Roasters
_____ Tokyo Tokyo Restaurant
_____ Yellow Cab Pizza Co.
_____ Bonchon Chicken
Job Type
_____ Restaurant Manager
_____ Staff
_____ Customer
Age
_____ 51 years old and above _____ 41-50 years old
_____ 31-40 years old
_____ 21-30 years old
_____ 20 years old and below
Sex
_____ Male
_____ Female
Civil Status
_____ Single
_____ Married
_____ Widow/er
Educational Attainment
_____ Doctoral Degree
_____ With Doctoral Units
_____ Master’s Degree
_____ With Master’s Units
_____ Bachelor Degree
_____ Undergraduate
PART II. DIGITAL INNOVATION OF SELECTED FAST CASUAL RESTAURANT IN
METRO MANILA
Direction: Kindly put a check mark ( ) on the number which accurately corresponds to your assessment of the level of impact of the following indicators:
Option Range Verbal Interpretation Symbol
5 4.20 - 5.0 Highly Evident HE
4 3.40 - 4.19 Evident E
3 2.60 - 3.39 Moderately Evident ME
2 1.80 - 2.59 Least Evident LE
1 1.00 - 1.79 Very Least Evident VLE
| ONLINE ORDERING SYSTEM | HE (5) | E (4) | ME (3) | LE (2) | VLE (1) |
| The restaurant’s online ordering system is easy to navigate and user-friendly. | |||||
| Customers can easily customize their orders (e.g., add/remove ingredients, choose sizes). | |||||
| The online ordering system provides accurate and updated menu information. | |||||
| The system allows customers to track their orders in real time. | |||||
| The restaurant’s online platform is reliable and rarely experiences technical issues. | |||||
| Customers receive timely notifications and confirmations for their online orders. | |||||
| The online ordering process reduces waiting time and enhances customer convenience. | |||||
| MOBILE APPLICATION FEATURES | HE (5) | E (4) | ME (3) | LE (2) | VLE (1) |
| The mobile app provides a smooth and intuitive user experience. | |||||
| Customers can easily access promotions and discounts through the app. | |||||
| The app allows for quick reordering of previous meals. | |||||
| Push notifications effectively inform customers about new products or offers. | |||||
| The mobile app integrates features like GPS location for nearby branches. | |||||
| The app’s interface design is visually appealing and reflects the restaurant’s brand. | |||||
| The mobile application loads quickly and performs well across different devices. | |||||
| INTEGRATION WITH THIRD-PARTY DELIVERY PLATFORMS | HE (5) | E (4) | ME (3) | LE (2) | VLE (1) |
| The restaurant partners with reliable third-party delivery services (e.g., GrabFood, Foodpanda). | |||||
| Orders placed through third-party platforms are processed accurately and promptly. | |||||
| The menu items displayed on delivery apps are consistent with in-store offerings. | |||||
| Delivery tracking via third-party platforms is accurate and up-to-date | |||||
| The restaurant maintains strong coordination with third-party delivery riders. | |||||
| Customer complaints from third-party platforms are addressed efficiently. | |||||
| The restaurant gains greater market reach through its third-party delivery partnerships. | |||||
| DATA ANALYTICS USAGE | HE (5) | E (4) | ME (3) | LE (2) | VLE (1) |
| The restaurant uses customer data to understand dining preferences and behavior. | |||||
| Data analytics help the restaurant optimize menu offerings and pricing strategies. | |||||
| Sales data are regularly analyzed to improve operational performance. | |||||
| The restaurant uses analytics to forecast demand and manage inventory effectively. | |||||
| Marketing decisions are supported by insights drawn from customer data. | |||||
| The restaurant uses data analytics to measure customer satisfaction and loyalty. | |||||
| Management uses data-driven insights to enhance business decision-making | |||||
| CONTACTLESS PAYMENT SOLUTIONS | HE (5) | E (4) | ME (3) | LE (2) | VLE (1) |
| The restaurant offers multiple contactless payment options (e.g., GCash, PayMaya, cards). | |||||
| The contactless payment process is fast and efficient. | |||||
| Customers feel secure using digital payment methods in the restaurant. | |||||
| Contactless payments help reduce transaction errors. | |||||
| The restaurant staff are knowledgeable in assisting with contactless transactions. | |||||
| Payment terminals and QR codes are easily accessible to customers. | |||||
| Contactless payment improves the overall convenience of dining or ordering. | |||||
| LOYALTY PROGRAM AUTOMATION | HE (5) | E (4) | ME (3) | LE (2) | VLE (1) |
| The restaurant’s loyalty program is fully integrated into its digital platforms. | |||||
| Customers can easily track points and rewards through the app or website. | |||||
| The loyalty program offers personalized rewards based on purchase history. | |||||
| Automated notifications remind customers about their reward status or expiry | |||||
| The digital loyalty system encourages repeat purchases. | |||||
| Registration and participation in the loyalty program are quick and simple. | |||||
| The loyalty program effectively enhances customer engagement and retention. |
PART III. SERVICE QUALITY OF SELECTED FAST CASUAL RESTAURANT IN
METRO MANILA
Direction: Kindly put a check mark ( ) on the number which accurately corresponds to your assessment of the level of impact of the following indicators:
Option Range Verbal Interpretation Symbol
5 4.20 - 5.0 Excellent E
4 3.40 - 4.19 Very Satisfactory VS
3 2.60 - 3.39 Moderately Evident S
2 1.80 - 2.59 Fair F
-
1.00 - 1.79 Poor P
| RESPONSIVENESS TO CUSTOMER REQUESTS | E (5) | VS (4) | S (3) | F (2) | P (1) |
| Staff promptly attend to customer needs and inquiries. | |||||
| Orders and special requests are handled without unnecessary delay. | |||||
| Employees demonstrate willingness to help customers at all times. | |||||
| The restaurant provides timely responses to online or phone inquiries. | |||||
| Service personnel remain attentive even during peak hours. | |||||
| The restaurant offers quick solutions when customers have issues or concerns | |||||
| The staff are proactive in offering assistance or additional services. | |||||
| RELIABILITY OF SERVICE DELIVERY | E (5) | VS (4) | S (3) | F (2) | P (1) |
| The restaurant consistently delivers orders accurately. | |||||
| Customers receive their meals within the promised time frame. | |||||
| The restaurant maintains consistency in food quality and taste. | |||||
| Service performance is dependable regardless of customer volume. | |||||
| Online and dine-in orders are processed with minimal errors. | |||||
| Customers can rely on the restaurant to deliver what it promises. | |||||
| The restaurant provides consistent operating hours and availability. | |||||
| TANGIBLES | E (5) | VS (4) | S (3) | F (2) | P (1) |
| The restaurant maintains a clean and orderly dining area. | |||||
| Tables, chairs, and utensils are well-maintained and hygienic. | |||||
| The staff’s uniforms are neat and presentable. | |||||
| The restaurant’s digital facilities (e.g., self-order kiosks, screens) are functional and modern. | |||||
| The overall ambiance of the restaurant is pleasant and comfortable. | |||||
| The restaurant’s layout allows for easy movement of customers and staff. | |||||
| Printed and digital materials (e.g., menus, displays) are visually appealing and updated. | |||||
| ASSURANCE | E (5) | VS (4) | S (3) | F (2) | P (1) |
| Staff demonstrate confidence and competence in performing their duties. | |||||
| Employees provide clear and accurate information about menu items. | |||||
| Customers feel safe when making transactions within the restaurant. | |||||
| Staff handle payments and digital transactions professionally. | |||||
| The restaurant enforces proper hygiene and food safety standards. | |||||
| Employees display courteous and respectful behavior at all times. | |||||
| Customers trust the restaurant’s brand and service quality. | |||||
| EMPATHY | E (5) | VS (4) | S (3) | F (2) | P (1) |
| Staff show genuine care and attention toward customers’ needs. | |||||
| The restaurant provides special accommodations for customers with specific needs (e.g., elderly, PWDs). | |||||
| Employees take time to listen to customer feedback and suggestions. | |||||
| The restaurant values regular customers and remembers their preferences. | |||||
| Service personnel display patience when dealing with customer concerns. | |||||
| Management ensures that customers feel valued and appreciated. | |||||
| The restaurant promotes a welcoming and inclusive atmosphere. | |||||
| HANDLING OF COMPLAINTS | E (5) | VS (4) | S (3) | F (2) | P (1) |
| Customer complaints are addressed quickly and professionally. | |||||
| Staff listen carefully to customer grievances before providing a solution. | |||||
| The restaurant has a clear and accessible complaint resolution process. | |||||
| Corrective actions are taken immediately when service lapses occur. | |||||
| Customers receive feedback or follow-up after filing a complaint. | |||||
| Management uses customer complaints to improve future service delivery. | |||||
| The restaurant maintains a positive attitude when resolving conflicts. |
Part IV: PROBLEMS ENCOUNTERED RELATIVE TO THE DIGITAL INNOVATION AND SERBVICE QUALITY OF SELECTED FAST CASUAL RESTAURANT IN METRO MANILA
Direction: Kindly put a check mark ( ) on the number which accurately corresponds to your assessment of the level of impact of the following indicators:
Option RangeInterpretation Symbol
5 4.20 - 5.00 Highly Encountered HE
4 3.40- 4.19Encountered E
-
2.60 - 3.39 Moderately Encountered ME
2 1.80 - 2.59 Lease Encountered LE
1 1.00 - 1.79 Very Least Encountered VLE
| Areas of Concern | HE (5) | E (4) | ME (3) | LE (2) | VLE (1) |
| Frequent system glitches make ordering inconvenient. | |||||
| The app lacks user-friendly features for easy navigation. | |||||
| Delays occur when processing orders through delivery partners. | |||||
| The restaurant does not fully utilize customer data for improvement. | |||||
| Some digital payment options are not consistently available. | |||||
| The rewards system often fails to update or record points correctly. | |||||
| Staff are sometimes slow to respond to customer inquiries or needs. | |||||
| Orders are occasionally inaccurate or incomplete. | |||||
| Dining areas and facilities are not consistently well-maintained. | |||||
| Some staff lack confidence and knowledge when addressing customer concerns. | |||||
| Employees rarely show genuine concern for customer satisfaction. | |||||
| Customer complaints are not always resolved in a timely and satisfactory manner. |
Part V: ACCEPTABILITY OF THE PROPOSED COMPETITIVE ADVANTAGE PLAN
Direction: Kindly put a check mark ( ) on the number which accurately corresponds to your assessment of the level of impact of the following indicators:
Option RangeInterpretation Symbol
5 4.20 - 5.00 Highly Acceptable HA
4 3.40- 4.19Acceptable A
-
2.60 - 3.39 Moderately Acceptable MA
2 1.80 - 2.59 Lease Acceptable LA
1 1.00 - 1.79 Very Least Acceptable VLA
| Areas of Concern | HA (5) | A (4) | MA (3) | LA (2) | VLA (1) |
| The proposed plan is aligned with the restaurant’s vision, mission, and strategic goals. | |||||
| The plan is feasible and practical to implement given the restaurant’s available resources. | |||||
| The proposed strategies can effectively strengthen the restaurant’s market position. | |||||
| The plan is financially viable and expected to yield positive business outcomes. | |||||
| The proposed initiatives are acceptable to both management and employees. | |||||
| The plan is responsive to customer needs and current industry trends. |